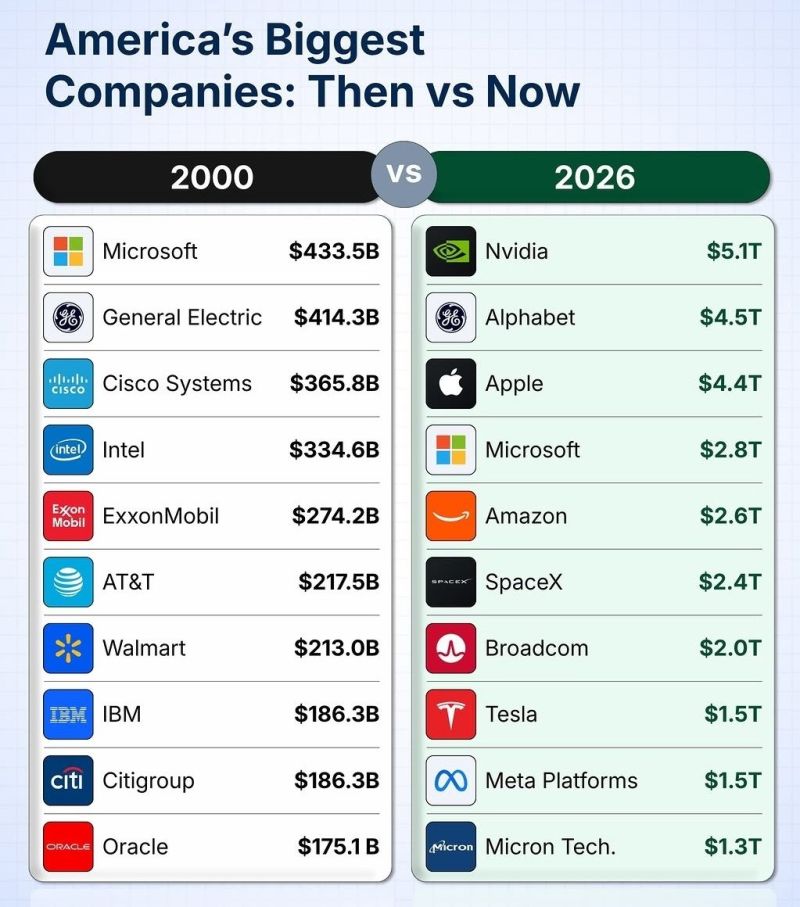
America's Biggest Companies in 2000 Vs 2026
Source: The Market Mind @Market_Mind_
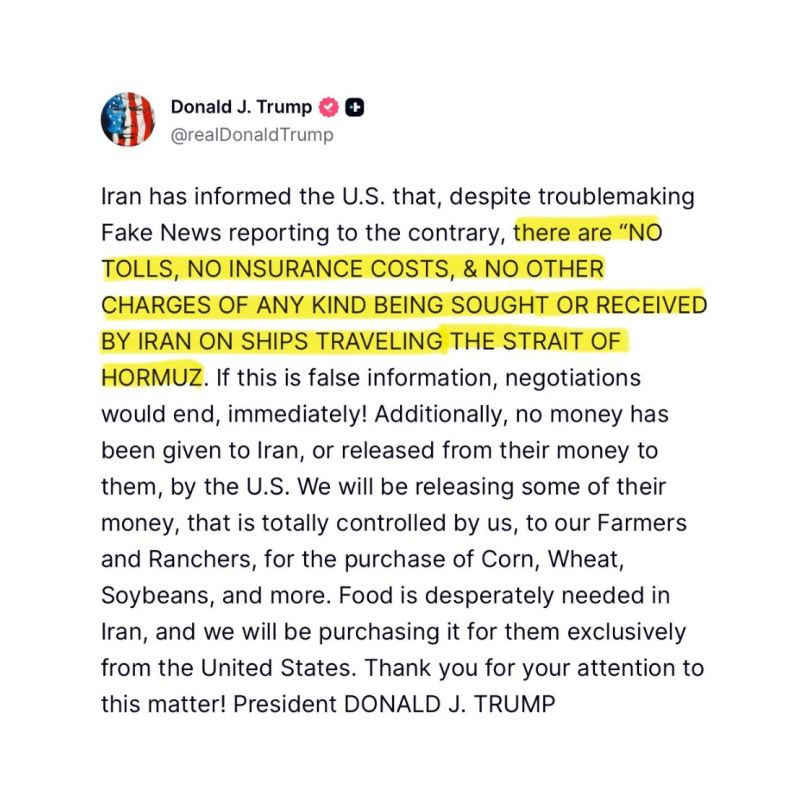
President Trump says Iran has agreed to keep the Strait of Hormuz fully open with NO tolls, fees, or shipping charges.
Trump also says the US will release controlled Iranian funds exclusively to buy American food products. “If this is false information, negotiations would end immediately.” Source: Bull Theory
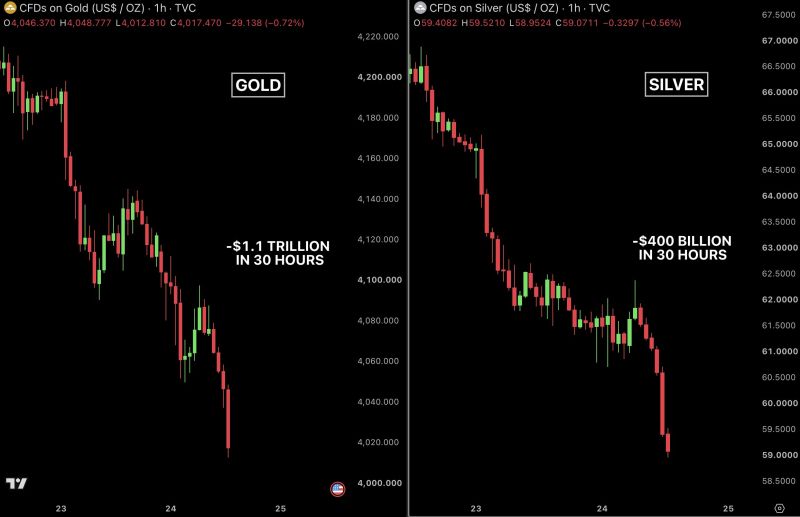
🚨Gold and silver are getting wrecked.
Last 30 hours: - Gold down -3.87%, wiping out $1.1 trillion. - Silver down -9.18%, wiping out ~$400 billion. Since the war started: - Gold down -25%, erasing $9.4 trillion. - Silver down -38%, erasing $2.7 trillion. From all time highs: - Gold down -28%, $11 trillion wiped. - Silver down -51%, $4.6 trillion wiped. Precious Metals were supposed to surge on war fear. Instead they crashed when the war started, and now they're crashing again as the war is ending. A buying opportunity ? Source: Bull Theory
Nancy Pelosi disclosed 2 new stock trades:
- Intel $INTC Calls: Bought 200 calls on May 29th at a $50 strike price expiring 3/19/27 spending between $1,000,001 - $5,000,000 on the calls - Uber $UBER Calls: Bought 200 calls on May 29th at a $50 strike price expiring 3/19/27 spending between $500,001 - $1,000,000 on the calls Source: Evan

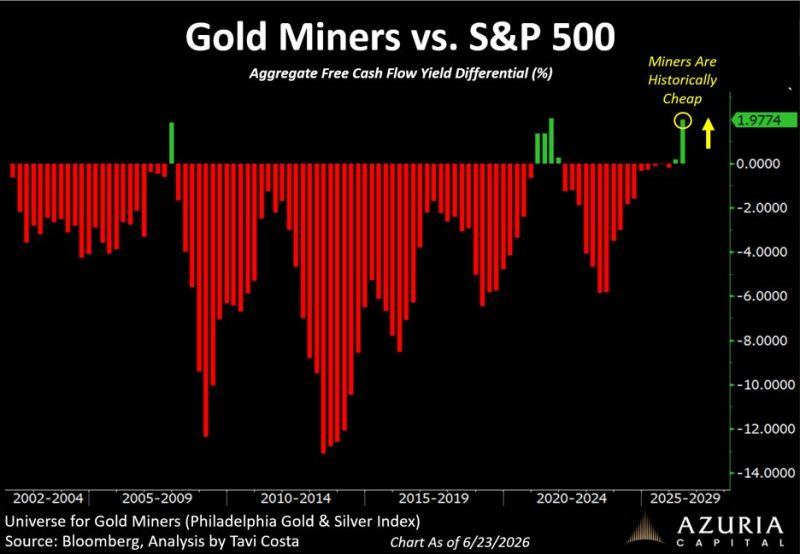
Gold miners are trading at one of the deepest discounts to the S&P 500 on record.
Fundamentals remain strong. Prices keep falling. Source: Otavio (Tavi) Costa
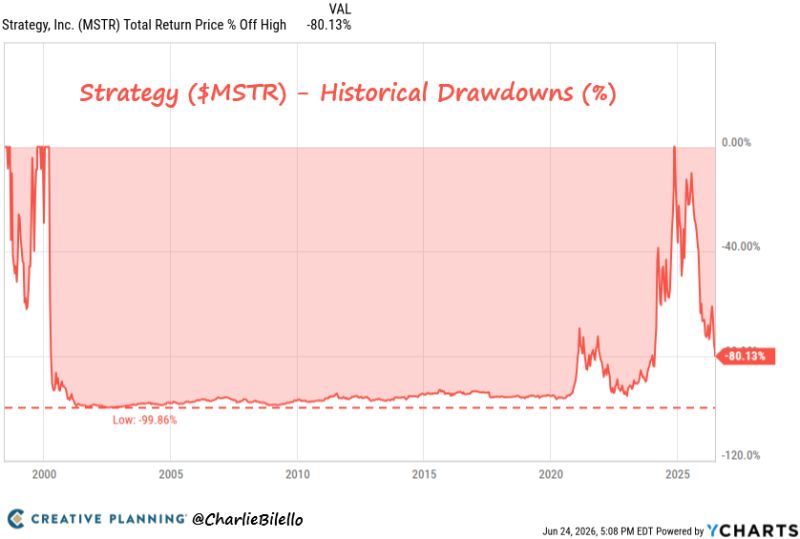
Strategy ($MSTR) is now down over 80% from its high.
Painful? Yes. Unprecedented? No. After the dot-com bust $MSTR fell 99.86%. If it were to match that, it mean another -99% decline from here. Source: Charlie Bilello
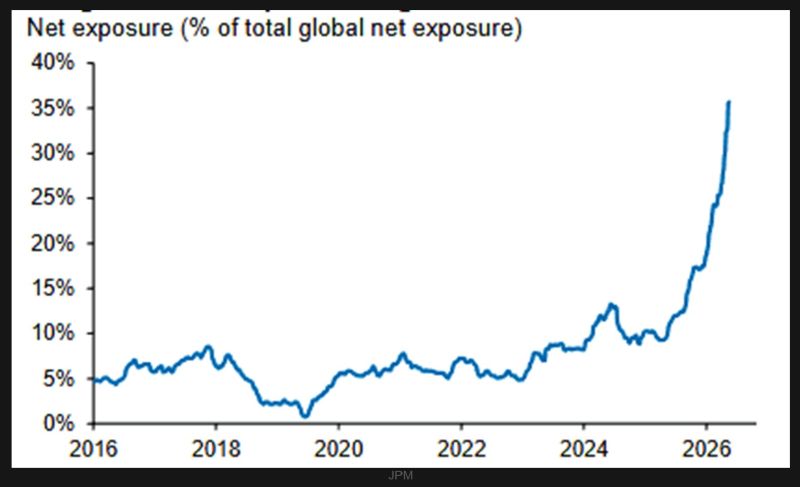
Hedge funds are all in on the semis long trade.
Source: JPM
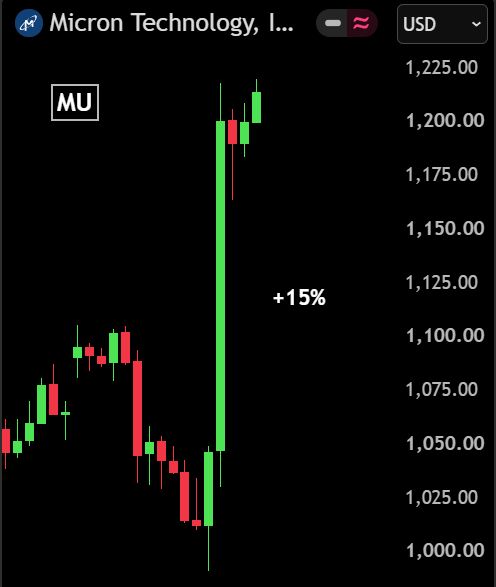
Micron just delivered one of the biggest earnings beats in semiconductor history.
The numbers are staggering: • Revenue: $41.46B vs $36.3B expected (+14%) • Adjusted EPS: $25.11 vs $21.05 expected (+19%) • Gross Margin: 84.6%, up from 37.7% a year ago 📈 Shares jumped +15% in after-hours trading. But the real story isn't this quarter. It's what's coming next. Micron's guidance absolutely crushed Wall Street: ➡️ Q4 Revenue: $50B vs $43B expected ➡️ Q4 EPS: $31 vs $25.07 expected ➡️ Gross Margin: 85% vs 84% expected The AI memory boom is accelerating faster than almost anyone expected. Micron also announced $22 BILLION in multi-year customer supply agreements, including: • Take-or-pay contracts • Customer cash deposits • Pricing floors Even more remarkable: 🔥 HBM3E and HBM4 production is already fully booked through 2027. 🔥 Demand is now extending into 2028. That's an extraordinary level of visibility for the AI infrastructure cycle. Here's the perspective that really stands out: Micron generated more profit this quarter than Nvidia made almost exactly one year ago. Yet Micron still trades at roughly a $1.1 trillion market cap. The AI infrastructure buildout isn't slowing down. If anything... It's accelerating. The AI race is no longer just about GPUs. Memory has become one of the biggest bottlenecks—and one of the biggest winners. The semiconductor cycle has entered a completely different phase. Source: Bull Theory