Straight from the Desk
Syz the moment
Live feeds, charts, breaking stories, all day long.
- All
- equities
- United States
- Macroeconomics
- Food for Thoughts
- markets
- Central banks
- Fixed Income
- bitcoin
- Asia
- europe
- investing
- geopolitics
- gold
- technical analysis
- Commodities
- Crypto
- AI
- Technology
- nvidia
- ETF
- earnings
- Forex
- china
- Real Estate
- oil
- banking
- Volatility
- energy
- magnificent-7
- apple
- Alternatives
- emerging-markets
- switzerland
- tesla
- United Kingdom
- Middle East
- assetmanagement
- amazon
- microsoft
- russia
- ethereum
- ESG
- meta
- Industrial-production
- bankruptcy
- Healthcare
- Turkey
- Global Markets Outlook
- africa
- Market Outlook
- brics
- performance
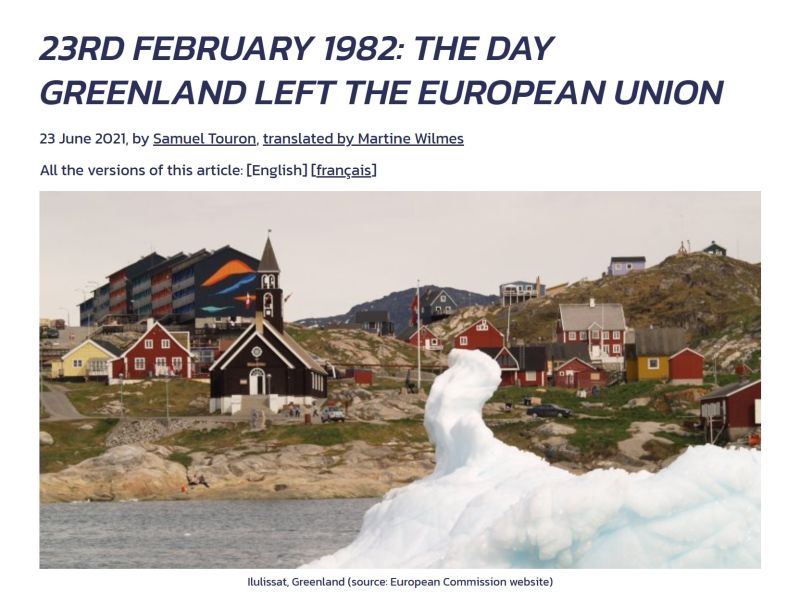
GREENLAND fact check #1: Greenland is NOT part of the European Union, despite being an autonomous territory within the Kingdom of Denmark, which is an EU member state.
Greenland has a unique history with the EU, being the only territory to ever leave it. Originally joining in 1973 as part of Denmark, Greenland’s population consistently opposed European integration. 1972 Referendum: 70% voted against joining the European Communities, but Greenland joined anyway as part of Denmark. 1982 Referendum: After gaining home rule in 1979, 52% voted to leave, driven by disputes over the Common Fisheries Policy, control of natural resources, and a sense that the EC ignored Greenland’s interests. Turnout was 74.9%. 1985 Withdrawal: Greenland formally left the EC on January 1, 1985, via the Greenland Treaty, becoming an Overseas Country and Territory (OCT) associated with the EU, maintaining some economic ties while regaining sovereignty over its fisheries.
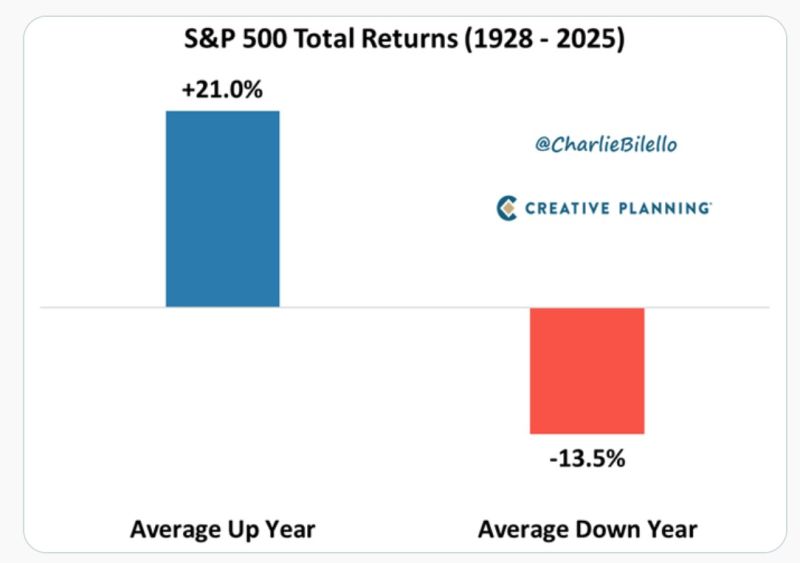
The average stock market return of 10% is misleading
Most years aren’t average - they’re extreme. Big gains. Sharp losses. That’s how long-term returns are made. Source: Peter Mallouk @PeterMallouk
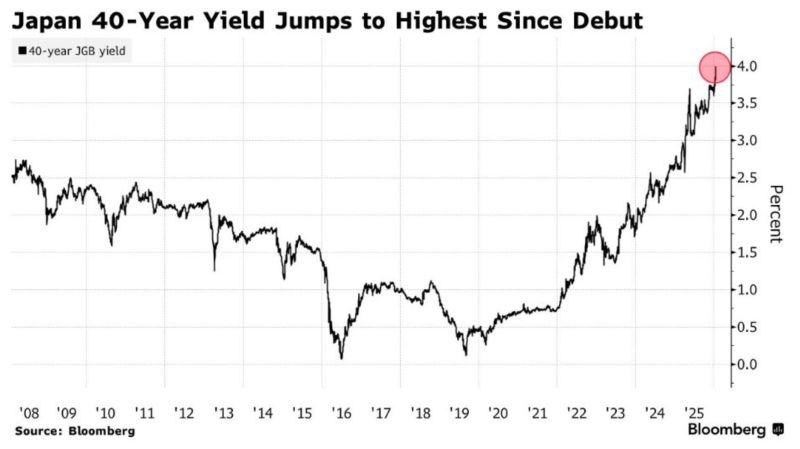
Japan's 40-year bond just hit 4% for the first time ever
Source: Joe Weisenthal @TheStalwart
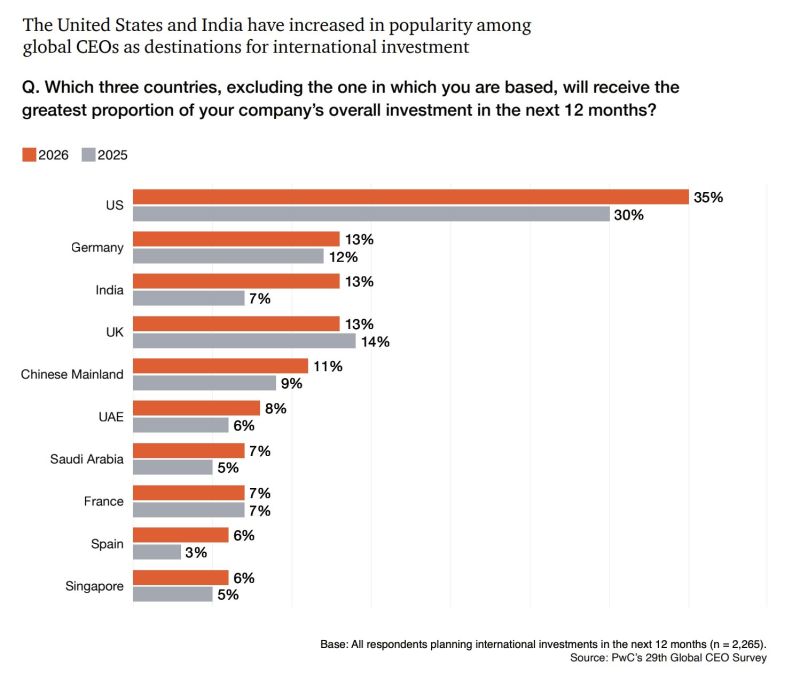
The United States has actually become more popular among global CEOs as a destination for international investment
Despite Trump’s interventions, acc to PwC’s CEO survey
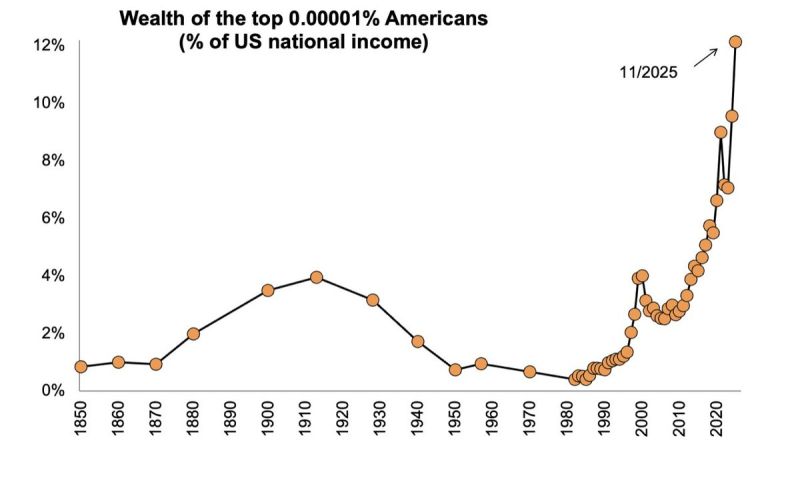
Wealth at the top: 0.00001% owns 12% of US income
At the peak of the Gilded Age in 1910, the richest 0.00001% of the US population owned wealth equal to 4% of national income. Now, the richest 0.00001% owns 12%. US billionaire oligarchs today are even wealthier than the original robber barons. Source: Ben Norton @BenjaminNorton on X
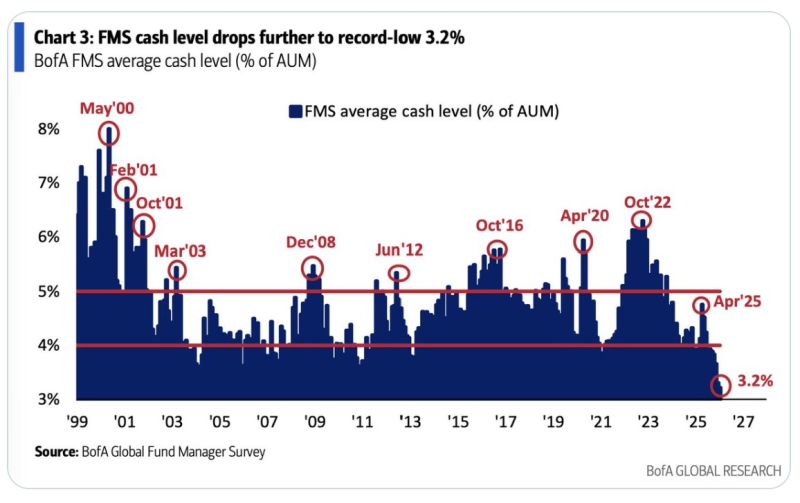
A (bearish) contrarian call?
January’s Fund Manager Survey is most bullish since Jul2021: expectations for global growth have jumped, cash levels have fallen to a record low of 3.2%, and protection against equity sell-off is at its lowest since Jan2018. BofA’s Bull & Bear Indicator flashing extreme optimism at 9.4. Source. HolgerZ, BofA
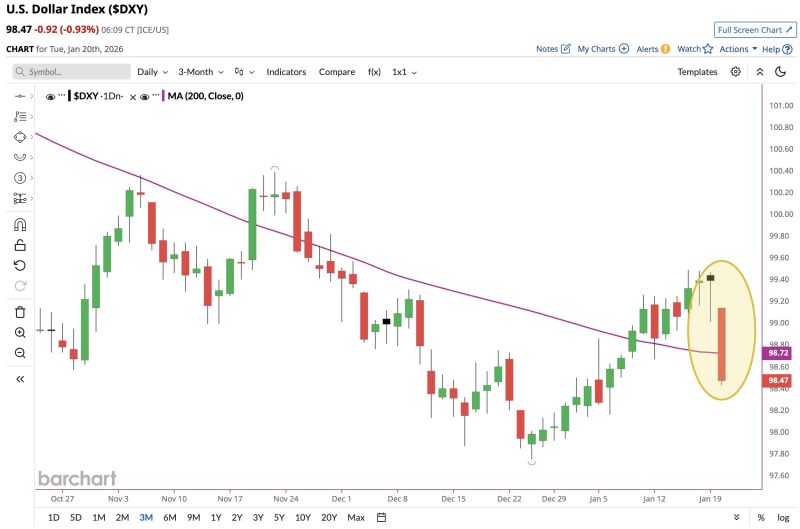
U.S. Dollar Index $DXY plunging below its 200-day moving average
Source: Barchart
GREENLAND FACT CHECK #2: The 1951 US Military Agreement
Greenland has a longstanding defense arrangement with the United States. On April 27, 1951, Denmark and the United States signed the Defense of Greenland Agreement, which remains in effect today. This treaty grants the United States significant military rights in Greenland: - The right to establish and operate military bases and “defense areas” in Greenland - Free movement of US ships, aircraft, and military vehicles across Greenland’s territory - The ability to construct facilities without paying rent or taxation to Denmark - Authorization to expand military presence if deemed necessary by NATO The most notable result of this agreement was the construction of Thule Air Base (now Pituffik Space Base) in northwest Greenland, which during the Cold War housed more than 10,000 US troops. Today, it remains the northernmost US Department of Defense installation, located 1,210 km north of the Arctic Circle. The agreement was updated in 2004 to recognize Greenland’s Home Rule government, but the fundamental military rights granted to the United States remain unchanged. The treaty continues in force as long as both countries remain NATO members.
Investing with intelligence
Our latest research, commentary and market outlooks


