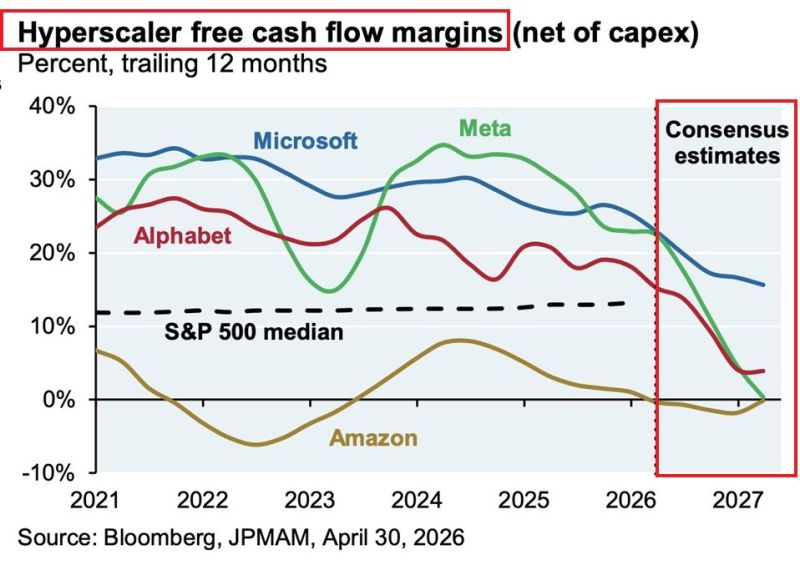
President Trump is flexing on his gains on $INTC...
Source: Donald Trump on Truth Social
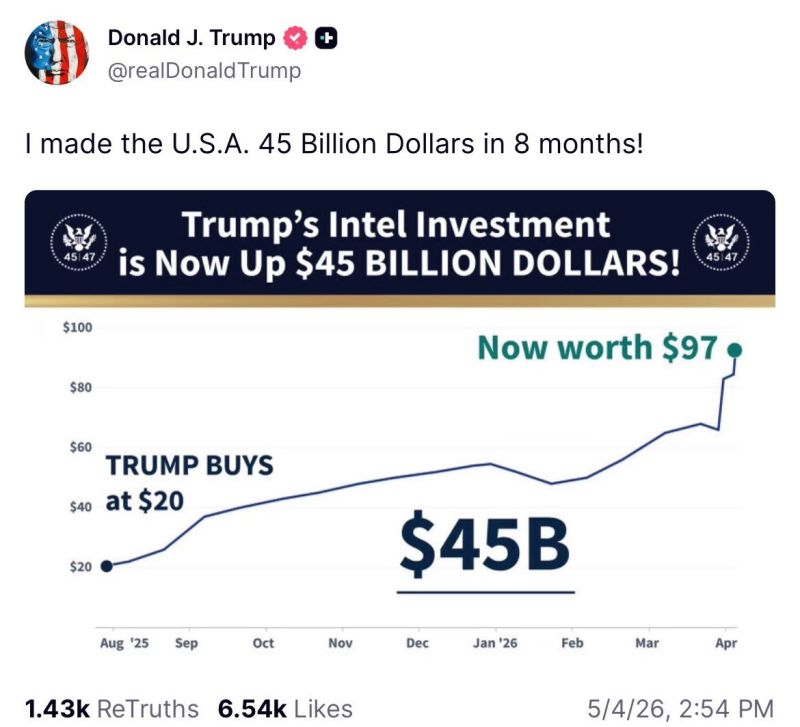
Bitcoin is trading above the key $80k level, with the “light golden cross” (50/100-day) now in place.
The 200-day MA sits slightly higher, a level that hasn’t seen a close above it since last October. Source: The Market Ear
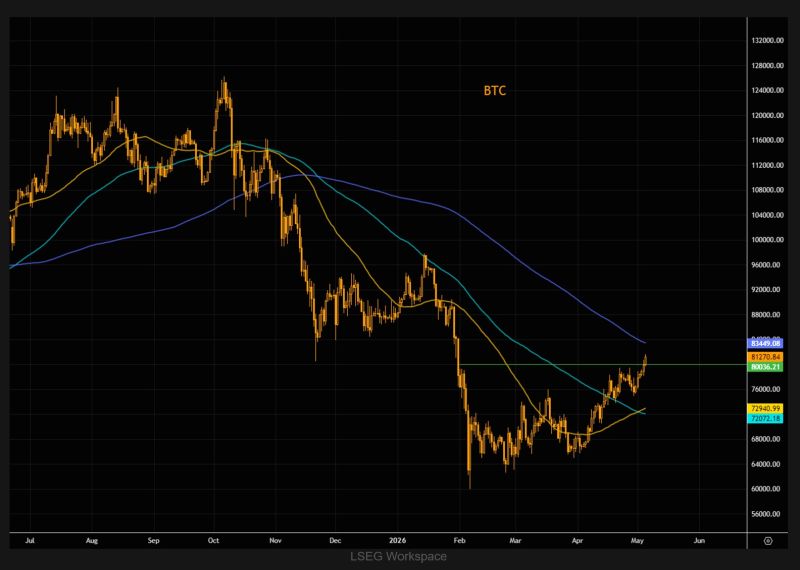
The NVDA fade
The short-term gap between NVDA and SMH continues to widen, with the month-end dislocation pushing into extreme territory. Source: The Market Fear
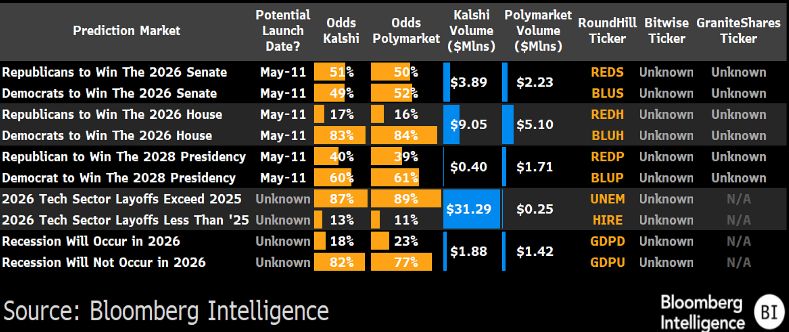
Bet on the President, the Fed, or CPI, skip the analysis, guesswork, and bias.
Eric Balchunas explained on X why prediction market ETFs may end up being far more popular—and legitimate—than most people expect. For every major macro event (elections, Fed decisions, inflation data), investors are flooded with expert opinions on which assets will rise or fall. Yet, time and again, the opposite happens. Prediction markets flip the approach. Instead of guessing how markets will react, you simply bet on the outcome itself—yes or no. It strips away interpretation, narrative, and bias. “But why use a prediction market ETF instead of going direct?” People asked the same question about crypto. The reality: most investors prefer ETFs. They’re regulated, low-cost, familiar, and fit seamlessly into brokerage accounts. That’s why this category has real potential—even if it comes with a bit of noise along the way. Source: Eric Balchunas on X Bloomberg Intelligence
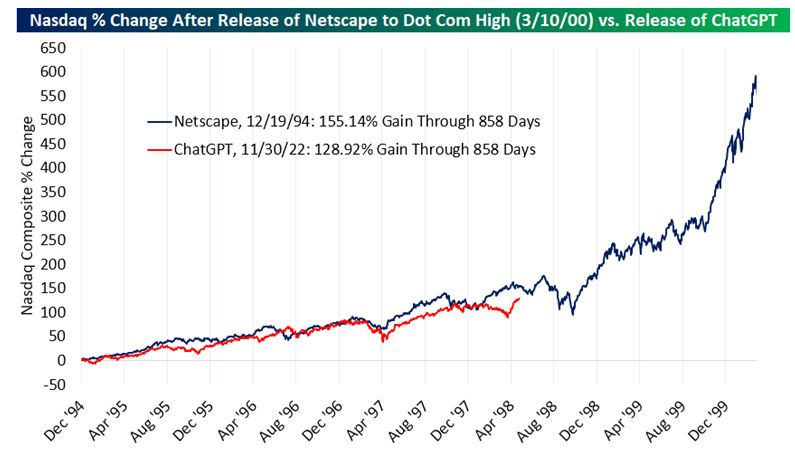
At 858 days since ChatGPT's release, the Nasdaq is currently up 129%.
858 days after Netscape's release, the Nasdaq was up 155%. "History doesn’t repeat itself, but it still rhymes. If this chart has any merit we might only be in the middle innings of this buildout." - Bespoke Source: Negligible Capital
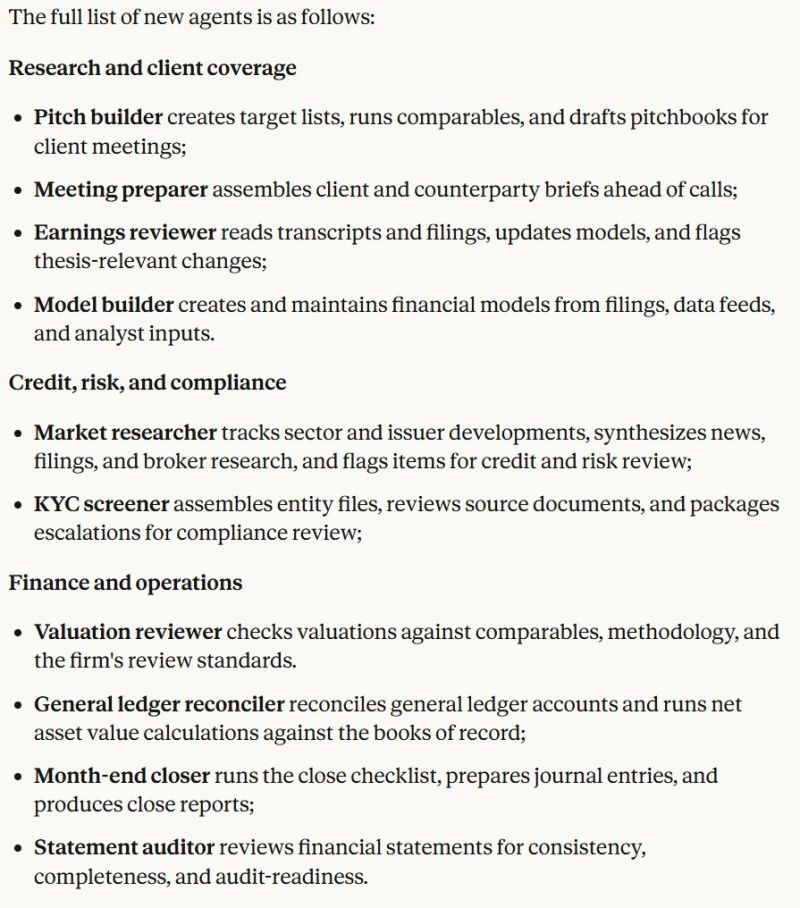
Anthropic is releasing 10 new agent templates for financial services
Source: Negligible Capital
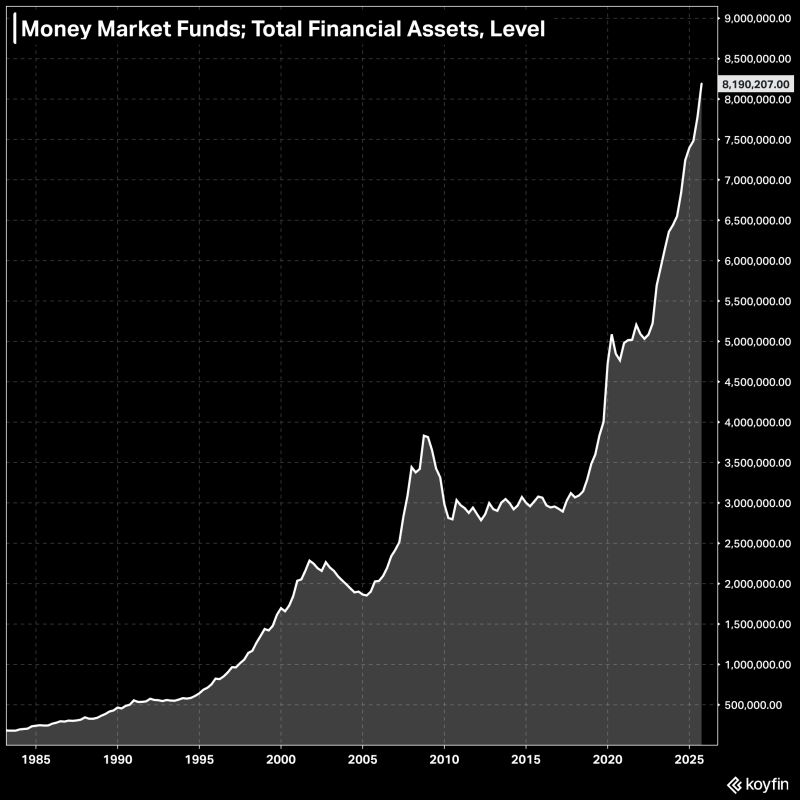
There is a record $8.19 trillion in money market funds right now.
Source: KoyfinCharts
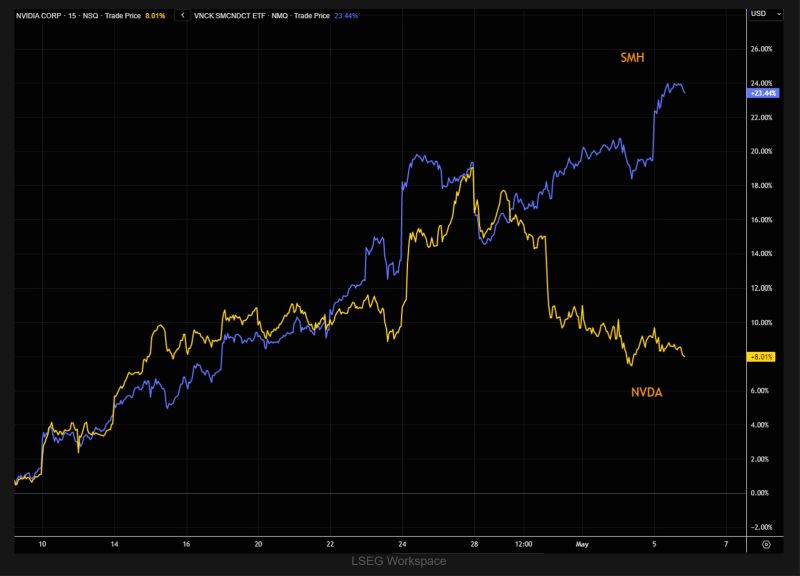
⚠️ The AI gold rush has a hidden cost… and Big Tech is footing the bill.
Here’s the reality no one wants to say out loud: • Big Tech free cash flow peaked at ~$300B in 2024 • By 2026… it’s heading toward ZERO Why? Because AI isn’t just innovation… it’s a capital black hole. → ~$715B in capex (2026) → +70% YoY increase → Nearly ALL cash flow consumed Margins are collapsing fast: • Microsoft → ~16% • Meta → ~3% • Alphabet → ~0% • Amazon → ~-2% So what’s happening behind the scenes? They’re borrowing. Aggressively. • ~$175B in new debt expected in 2026 • Buybacks slowing across the board • Key equity support disappearing Translation: The AI boom isn’t being funded by profits… It’s being funded by leverage. And that changes everything. Less cash flow + more debt + fewer buybacks = ⚠️ Fragile market structure The uncomfortable truth: AI may define the future… But it’s draining the present. And the bill is just getting started. Source: Global Markets Investor, JPM, Bloomberg