Bitcoin is starting to show some positive signs
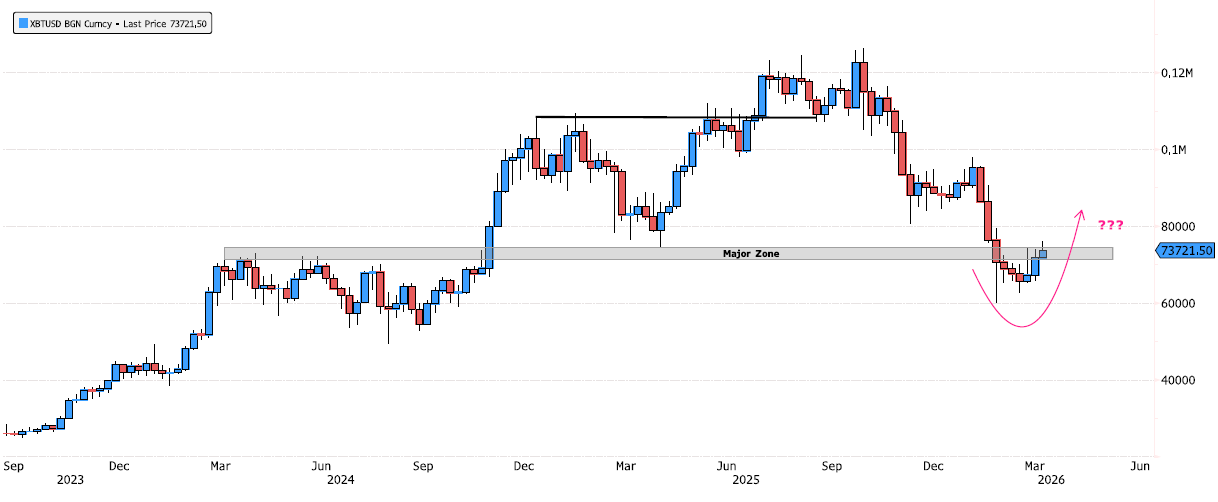
Since October 2025, BTC has been in a 52% consolidation phase. On the surface, the picture may look ugly, especially after the recent break below the major swing low at 74,424. But there is an important nuance. So far, we have only seen one candle break that level and print a new low. Since then, Bitcoin has spent 6 consecutive weeks printing inside bars. That kind of price action can often be interpreted as an accumulation zone rather than outright weakness. The key area Bitcoin is now trying to reclaim is 71,732–74,424. A weekly close back above that range would be the first constructive signal and could suggest that sellers are losing control. The second level to watch is 79,285. A move above that would strengthen the case for a more meaningful recovery. For now, Bitcoin remains at a critical technical juncture: Reclaim 71,732–74,424 = first positive confirmation Break above 79,285 = stronger bullish signal This is definitely a chart worth watching closely in the coming weeks. Source: Bloomberg
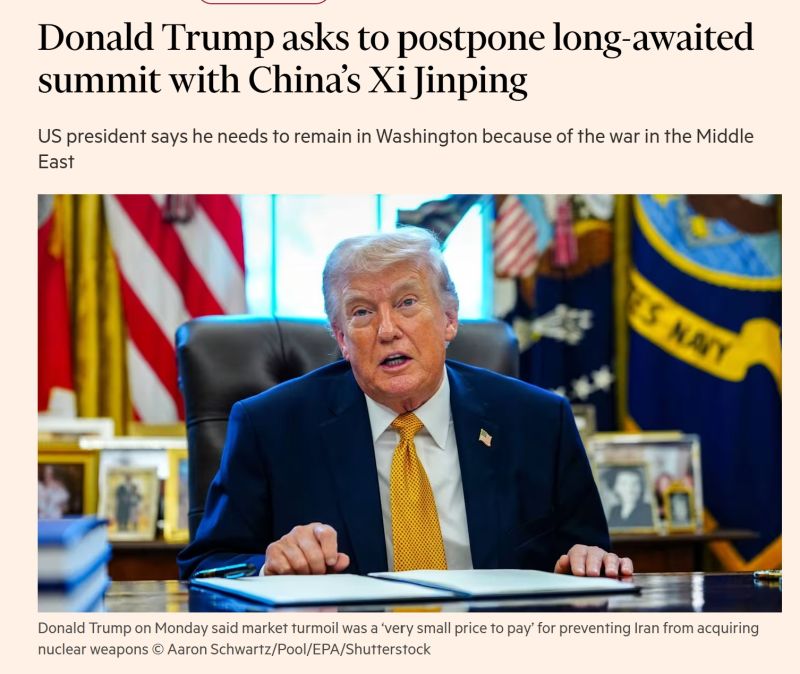
Donald Trump has asked Beijing to postpone his upcoming meeting with Xi Jinping in China, casting doubt on the long-awaited summit between the US president and his Chinese counterpart.
Trump told reporters in the Oval Office on Monday afternoon that he wanted to delay the summit by a month as he grapples with the war in Iran. He had been scheduled to leave for Beijing in just over two weeks. “I’d love to but because of the war, I want to be here,” Trump said, adding the White House had requested Beijing “delay” the visit by “a month or so”. “It’s very simple. I have got a war going on,” he added. Trump’s push to delay the summit comes as the White House deals with the dramatic fallout from the ongoing conflict in the Gulf, including the closure of the Strait of Hormuz. The closure of the strait, through which 20 per cent of the world’s oil passes, has had a major impact on the price of crude, sending the cost of petrol soaring in the US just months before critical midterm elections. Source: FT
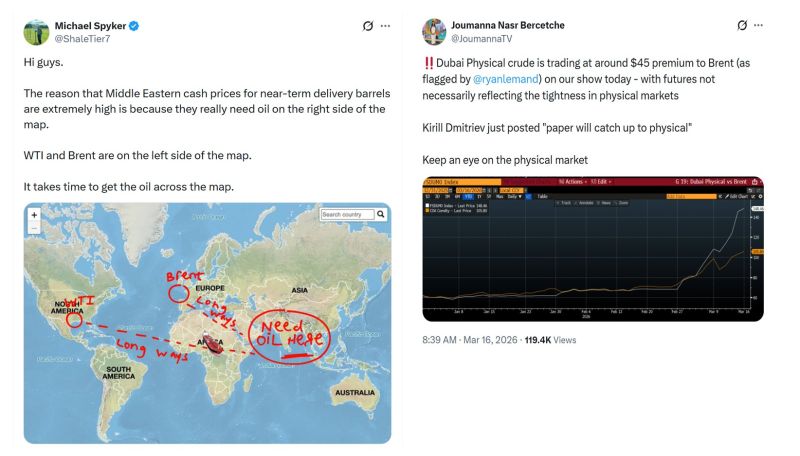
Dubai Physical Prices vs. Brent Futures
As highlighted by Anton Likhodedov @ALikhodedov on X: Many people are questioning why Brent futures aren’t higher and pointing out the massive premium of Dubai oil physical versus Brent futures (see post by Joumanna Bercetche on X his morning following her interview with Brent futures probably don’t fully reflect the severity of the current situation, but a few additional points—building on Michael’s chart on the right —are worth considering: 1) Brent reflects forward delivery and location differences. Brent is currently trading the May contract, and in about two weeks the market will roll to June. These contracts represent crude loading in the North Sea, while much of the incremental demand is in Asia. 2) Shipping times significantly affect the landed price. Looking at the Sparta dashboard, voyage times from the North Sea (for example Hound Point for Forties) to key Asian destinations are roughly: India / Singapore / South Korea: ~37–48 days By comparison: Fujairah → India (Sikka): under 3 days Fujairah → Singapore: about 11 days When you factor in these logistics, the difference in arrival times is substantial, which explains a large portion of the price discrepancy. 3) Crude quality also matters. As June Goh from Sparta explains in the article below, Asian refiners are also dealing with crude slate optimization and diversification, which affects pricing dynamics. That said, the gap between landed prices of Atlantic Basin cargoes and Fujairah cargoes has widened significantly. As a result, some Asian refiners are beginning to consider Brent despite the longer shipping time. A notable example: Trafigura sold a cargo of about 700,000 barrels for late-March loading to a Thai refiner. It’s reportedly the first time a Thai company has bought North Sea crude since at least 2019, when Bloomberg began tracking the data.
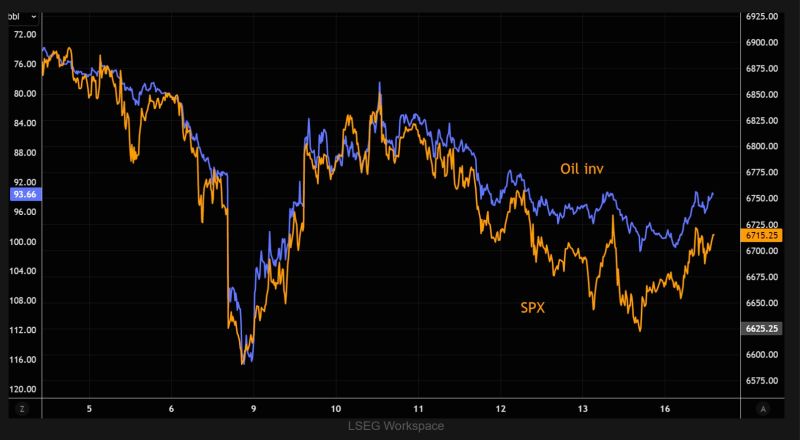
All about oil
SPX and oil moving in pretty much perfect inverse tandem. Correlations since March 4th around 96%. Source: TME
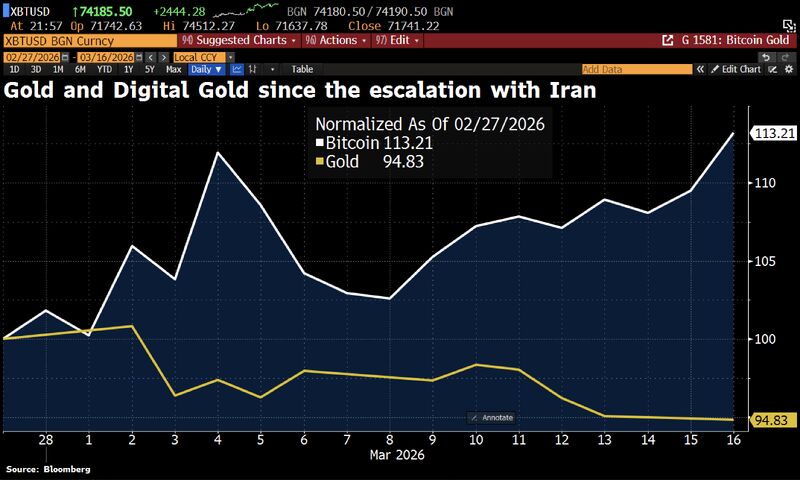
Bitcoin & crypto markets have looked resilient in the face of the Middle East conflict, outperforming Gold and equity indices.
"Maybe it takes a physical conflict to realise Bitcoin remains the most portable (cross border), digital and liquid asset w/no counter-party risks," Bernstein analyst Gautam Chhugani wrote in a note. Key Implications of the Statement: ➡️ Cross-Border Portability: Bitcoin can be transferred anywhere in the world, bypassing traditional banking restrictions that may arise during conflicts. ➡️Digital Nature: Being entirely digital, it is not susceptible to physical seizure, unlike gold or fiat currency. ➡️No Counter-party Risk: Because Bitcoin is decentralized, it does not rely on a central bank or government to guarantee its value or facilitate transactions. ➡️Liquidity: The asset can be readily exchanged, providing a financial safety net when local banking systems are compromised. Chhugani has previously pointed to rising tensions as a catalyst for investors to reconsider Bitcoin as a "safe haven" asset that operates outside of traditional financial infrastructure. Source: Bloomberg, HolgerZ
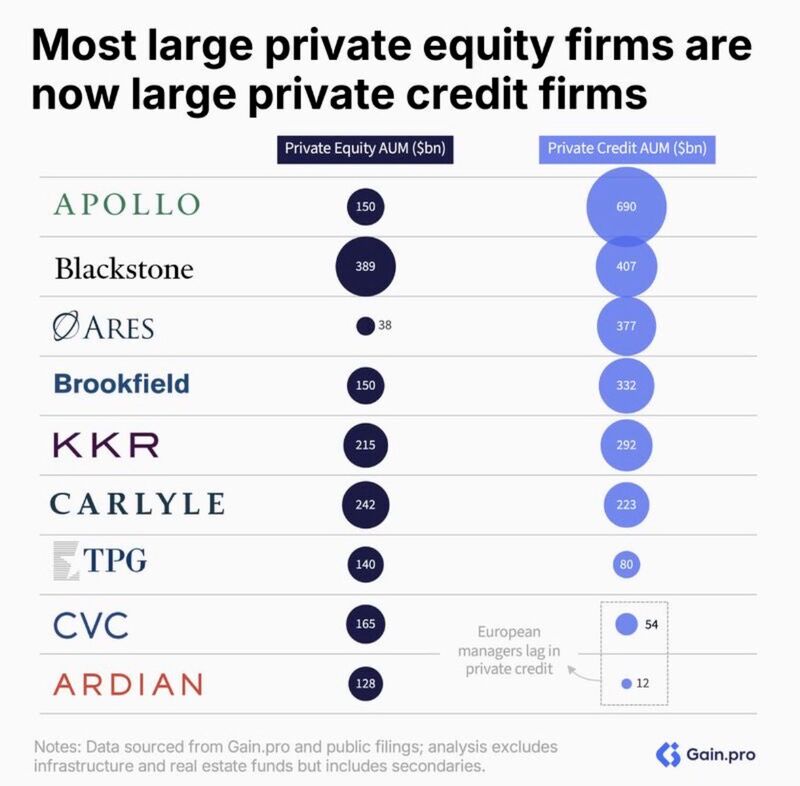
Private credit managers: “If you think debt is impaired, private equity is really cooked”
Also private credit managers: Source: @LeylaKuni, Gain.pro
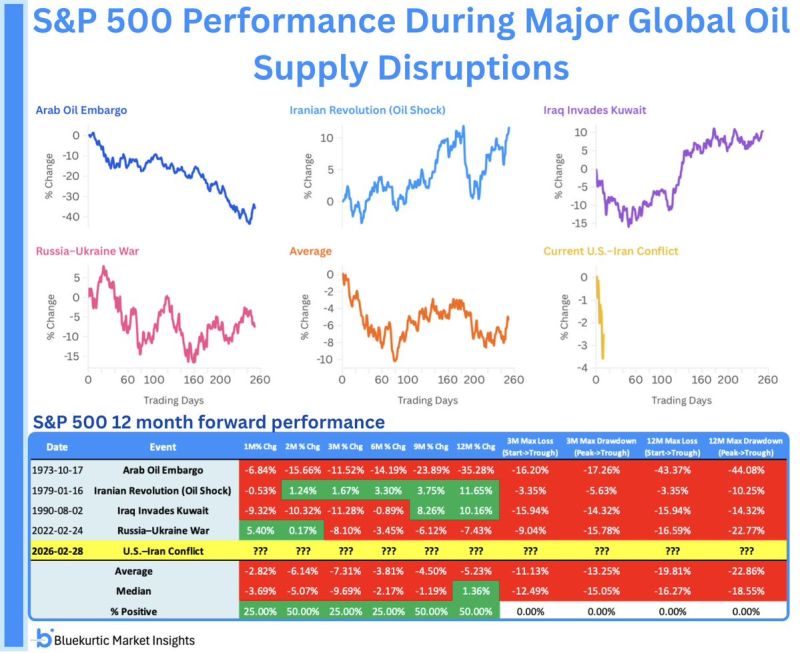
Bluekurtic Market Insights: "$SPX volatility index $VIX remains above 20 and oil at multi year highs.
Sustained oil supply shocks can risk deeper drawdowns. In prior cases of prolonged supply disruptions, S&P 500 saw above average drawdowns in the following 3 months". Source: Bluekurtic
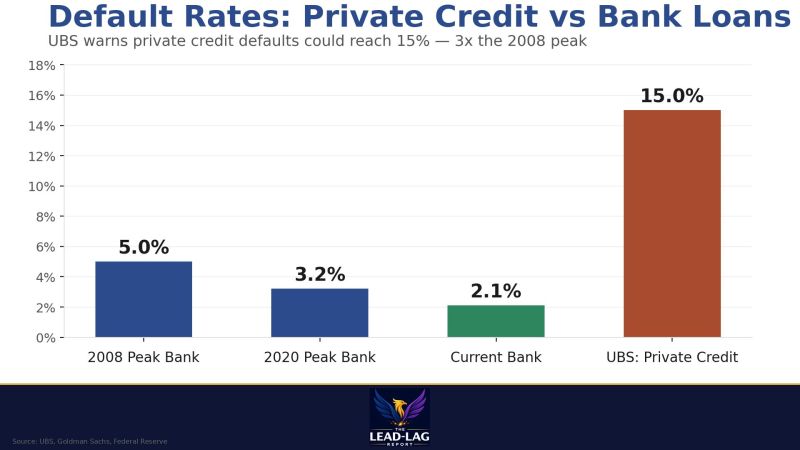
UBS says private credit defaults could hit 15%.
That's 3x the peak bank loan default rate in 2008. Source: Leadlag report, Michel Gayed