Straight from the Desk
Syz the moment
Live feeds, charts, breaking stories, all day long.
- All
- equities
- United States
- Macroeconomics
- Food for Thoughts
- markets
- Central banks
- Fixed Income
- bitcoin
- Asia
- europe
- investing
- geopolitics
- technical analysis
- gold
- Commodities
- Crypto
- AI
- Technology
- nvidia
- ETF
- earnings
- Forex
- china
- Real Estate
- oil
- banking
- Volatility
- energy
- magnificent-7
- apple
- Alternatives
- emerging-markets
- switzerland
- tesla
- United Kingdom
- Middle East
- assetmanagement
- amazon
- russia
- ethereum
- microsoft
- ESG
- meta
- Industrial-production
- bankruptcy
- Healthcare
- Turkey
- Global Markets Outlook
- africa
- Market Outlook
- brics
- performance
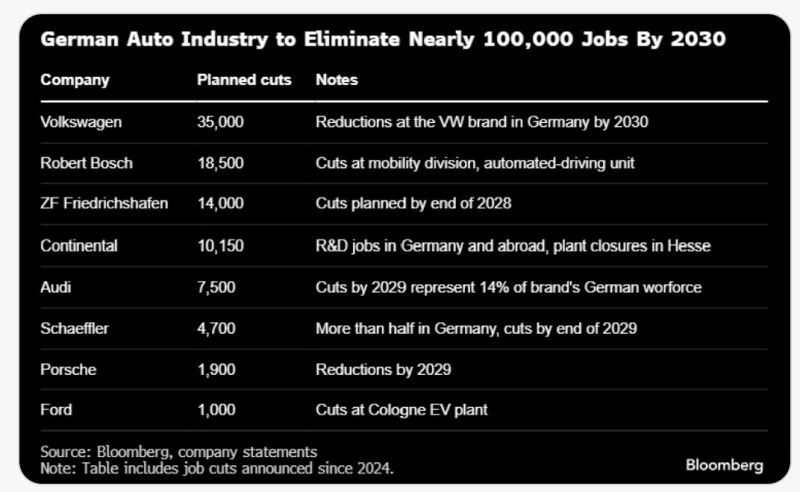
The German auto industry is expected to eliminate nearly 100,000 jobs by 2030.
Carmakers and their suppliers are struggling w/waning demand, high labor & energy costs & intensifying competition from Chinese manufacturers. Overall, Germany’s auto sector has lost roughly 55,000 jobs over the past 2yrs. Tens of thousands of additional positions are set to disappear by 2030, in an industry that employs more than 700,000 people. Source: HolgerZ, Bloomberg
Since 2019 the S&P 500 is up 125%.
76% of that is coming from earnings growth and 19% from dividends. As mentioned by Ryan Detrick, this isn't a bubble, this rally is justified from strong earnings growth. Source: Carson
🚨 BREAKING:
➡️ US PCE Price Index (Aug) YoY 2.7% vs 2.7% Est PCE MoM 0.3% vs 0.3% Est ➡️US Core PCE Price Index (Aug) YoY 2.9% vs 2.9% Est (Highest PCE reading since February) MoM 0.2% vs 0.2% Est EXACTLY AS EXPECTED. BULLISH 🚀 FOR MARKETS
Aryzta reaching first support
Aryzta remains in a bullish long-term trend. Currently in the discount zone (below 50% Fibonacci) and even below 61.8% (last swing 57.72 – 87.60). It’s now trading on the first support zone at 66.40 – 70.48. 👉 A rebound could take shape here, so keep an eye on the price action. That said, we can’t exclude a break lower with a retest of the major support zone 57.72 – 61.60. Source: Bloomberg
China controls close to 90% of the global rare earth market, and it has a track record of weaponizing exports when tensions rise.
Any new tariffs could invite retaliation, slower licensing, outright restrictions, or targeted disruptions that hit automakers, electronics, and magnet producers with higher costs and production delays. The ripple effects wouldn’t stop there, more expensive inputs could feed inflation and strain global supply chains. The G7 and the EU are weighing new ways to chip away at China’s rare earths dominance. Tariffs or taxes on Chinese exports are on the table along with price floors and subsidies to jump start mining and processing capacity outside Beijing’s reach. Source: StockMarket.news
US Treasury secretary Scott Bessent said that Washington was in talks to provide a $20bn swap line to Argentina
Source: FT
IBIT Zero Date Option Covered Call ETF launching today.. $BITK
Source: Eric Balchunas, Bloomberg
Are you waiting for a Bear Market to invest?
This is a great idea in theory, but historically only 20% of future Bear Markets brought prices below prevailing levels. Source: Charlie Bilello
Investing with intelligence
Our latest research, commentary and market outlooks


