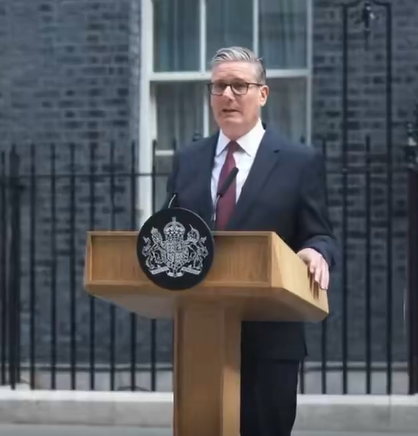
It's official! Keir Starmer has announced his resignation as UK Prime Minister and leader of Labour Party .
Andy Burnham now positioned as a potential successor, setting Britain on track for its seventh prime minister in just a decade.
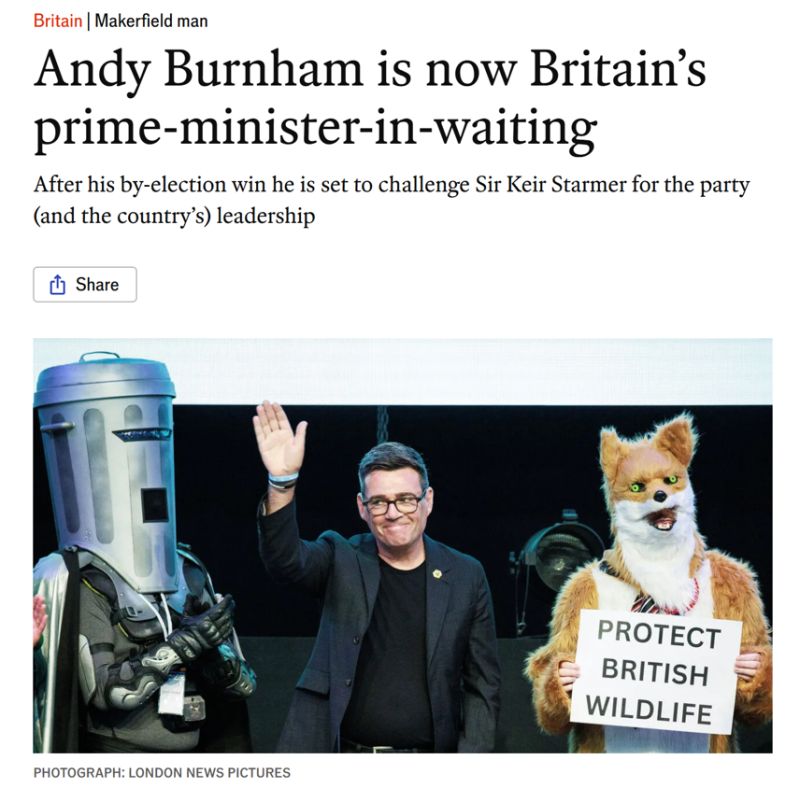
Greater Manchester mayor Andy Burnham is now widely considered the frontrunner to become Britain's next prime minister following Sir Keir Starmer's resignation
➡️ Who is he? Andy Burnham, 56, is the Labour mayor of Greater Manchester, the "King of the North," who built his profile on regional regeneration ("Manchesterism"). ➡️ How can he become the UK new PM? On June 19 he won the Makerfield by-election with nearly 55%, clearing his path to challenge PM Keir Starmer for the Labour leadership. Under party rules he needs 81 MPs to trigger a contest; the UK system would let him become PM without a general election. ➡️ How his policy could diverge from Starmer? Burnham sits left of the Starmer–Reeves administration. He has vowed to put energy, housing, water and transport under "stronger public control" and backs nationalising Thames Water. The market-relevant point: he previously said the UK must stop being "in hock to the bond market" and floated ~£40bn of extra borrowing, with defence spending outside the fiscal rules. The core divergence is a looser fiscal stance versus Reeves's self-imposed rules. ➡️Could the UK face another fiscal crisis? This is a real tail risk, partly priced, but most analysts see a Truss-style blowup as unlikely rather than negligible. Bear case: the UK has the G7's highest borrowing costs, long gilts above 5%, and minimal headroom; the by-election win push 10-year yields up, and some warn markets underestimate the risk of Burnham testing the rules. The 2022 Truss episode is the reference point. A drawn-out contest adds a risk premium, and the chancellor pick (Number 11) matters more than Number 10. Mitigants: Burnham is walking back his rhetoric, now backing the fiscal rules; the Truss episode itself disciplines any successor; and oil, not politics, is currently the main gilt driver. Net: not a base-case crisis, but a credible left-tail — most likely triggered by a disorderly transition plus an unfunded Autumn Budget. Watch items: long-end gilts, the gilt-Bund spread, and sterling on escalation. Key markers ahead: whether 81 MPs line up, transition speed, and the prospective Treasury team.
Every World Cup winner comes from this triangle.
Source: Philippe Gijsels

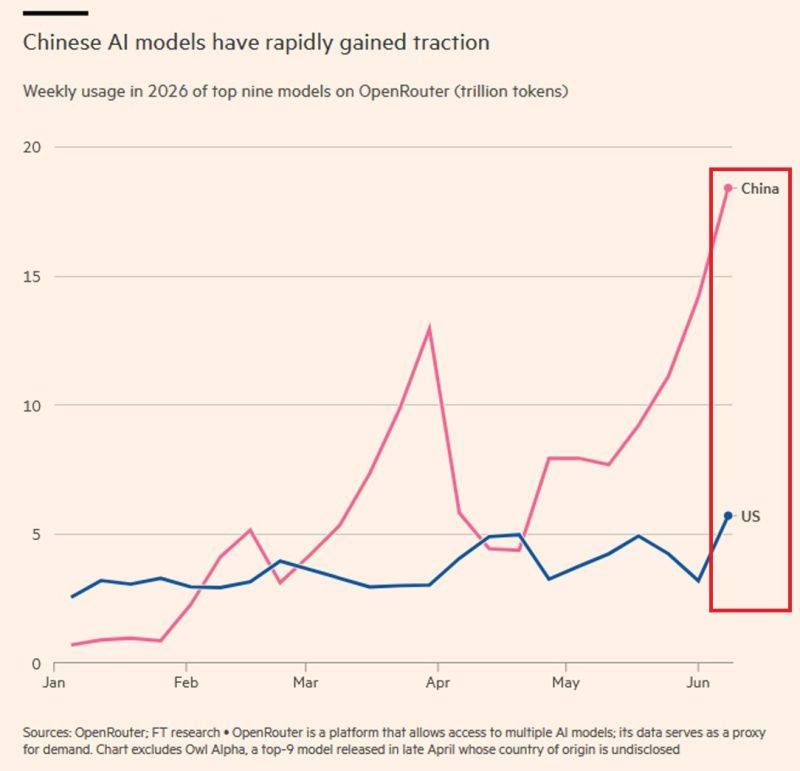
🚨 The AI race is entering a new phase.
Not because demand is slowing. Because costs are becoming impossible to ignore. Here are the numbers: 📈 Chinese AI models now process ~18.5 trillion tokens per week on OpenRouter. 🇺🇸 US models? Around 6 trillion. That's a 3x gap. Why? • Lower energy costs. • More efficient models. • Aggressive pricing that's reshaping the competitive landscape. Meanwhile, something interesting is happening inside large enterprises. Companies including Amazon, Walmart, Cisco, Uber, and Meta are reportedly introducing internal limits on AI usage as spending exceeds expectations. One striking example: A software company saw its AI bill jump 7x overnight after moving from a flat-rate subscription to usage-based pricing. Suddenly, the true cost of AI became visible. And this is only the beginning. 📊 Goldman Sachs estimates AI agents could increase token consumption by 24x by 2030. That creates a fundamental challenge: AI demand may keep exploding... while AI budgets become increasingly constrained. The next competitive advantage won't just be building the smartest models. It will be building the most cost-efficient ones. The AI story is evolving: ➡️ From "Who has the biggest model?" ➡️ To "Who delivers the lowest cost per useful output?" The winners of the next AI wave may not be those with the most compute... ...but those who make intelligence affordable at scale. Do you think AI spending is finally reaching a reality check, or is this just a temporary pause before the next investment wave? Source: FT, Global Markets Investors
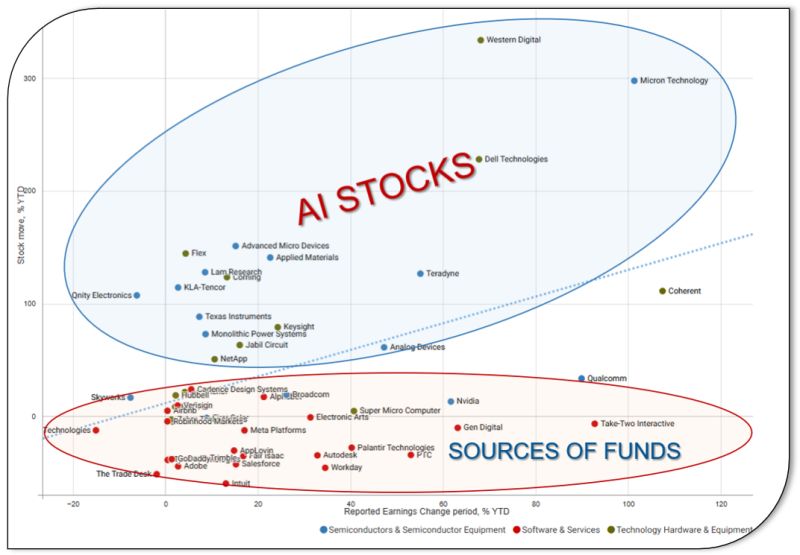
There are 2 markets currently 1) The AI stocks; 2) The sources of funds to buy the AI stocks
This scatterplot chart below shows that earnings do matter for AI-themed stocks, but for the rest of the Technology universe, earnings really don't matter YTD. Source: Konstantin Fominykh
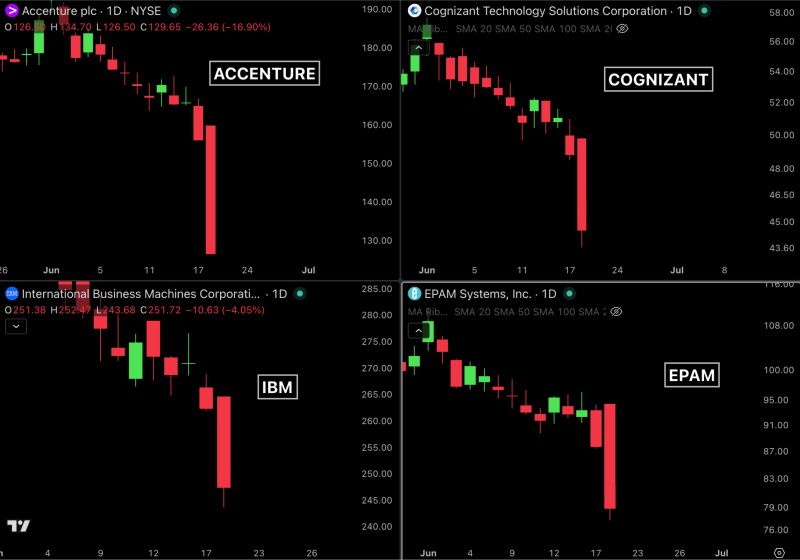
MASSIVE BLOODBATH IN THE IT OUTSOURCING SECTOR.
Accenture reported earnings this morning and cut its full-year revenue forecast. Its quarterly bookings fell 2% and the stock crashed 18%. Accenture is the largest IT services company in the world, so when it reports weak demand, every other company in the sector falls with it. Cognizant fell nearly -8%. Wipro fell nearly -8%. Capgemini fell -8.4% to its lowest price in a year. IBM fell -4%. EPAM dropped to near a 52-week low. Two things are driving the selloff. Companies are spending less on IT consulting as the economy slows, and the market now believes AI is starting to do the work these companies used to charge billions for. Both pressures hit the same business model at the same time. This is a direct problem for India. Indian IT has been one of the only sectors holding up the Nifty. TCS, Infosys, HCLTech, and Wipro have been carrying the index. These companies run on the same model as Accenture and earn most of their revenue from US and European clients. Accenture's results are treated as a preview of what is coming for TCS and Infosys. Their US-listed shares already fell 3 to 5% tonight. No surprise Indian markets are getting hit... Source: Bull Theory
IRAN SUSPENDS U.S. PEACE TALKS LESS THAN 24 HOURS AFTER SIGNING DEAL
Iran has reportedly suspended the entire 60-day negotiation process with the U.S., citing Israeli strikes on Lebanon, according to Fars and Al-Mayadeen. Vice President JD Vance has reportedly postponed his planned trip to Switzerland, where U.S.-Iran talks were set to begin Friday, per Axios. Both delegations were preparing to depart before the talks were called off. Note that is barely moving Source: Coin Bureau

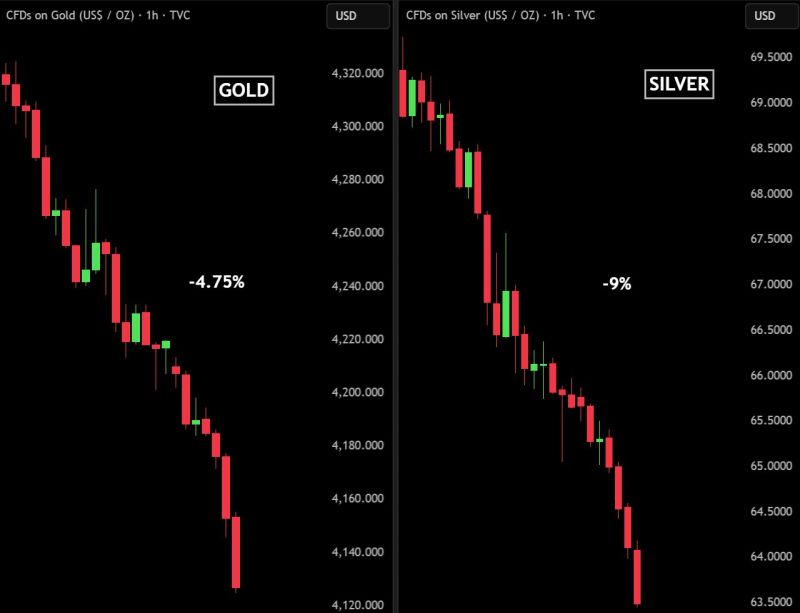
PRECIOUS METALS ARE CRASHING
Over $1.74 TRILLION has been wiped out from precious metals in the last 24 HOURS. Gold is down -4.75%, wiping out $1.41 trillion from its market cap. Silver is down -9%, wiping out $327 billion from its market cap. Source: Bull Theory