Straight from the Desk
Syz the moment
Live feeds, charts, breaking stories, all day long.
- All
- equities
- United States
- Macroeconomics
- Food for Thoughts
- markets
- Central banks
- Fixed Income
- bitcoin
- Asia
- europe
- investing
- geopolitics
- gold
- technical analysis
- Commodities
- Crypto
- AI
- Technology
- nvidia
- ETF
- earnings
- Forex
- china
- Real Estate
- oil
- banking
- Volatility
- energy
- magnificent-7
- apple
- Alternatives
- emerging-markets
- switzerland
- tesla
- United Kingdom
- Middle East
- assetmanagement
- amazon
- microsoft
- russia
- ethereum
- ESG
- meta
- Industrial-production
- bankruptcy
- Healthcare
- Turkey
- Global Markets Outlook
- africa
- Market Outlook
- brics
- performance
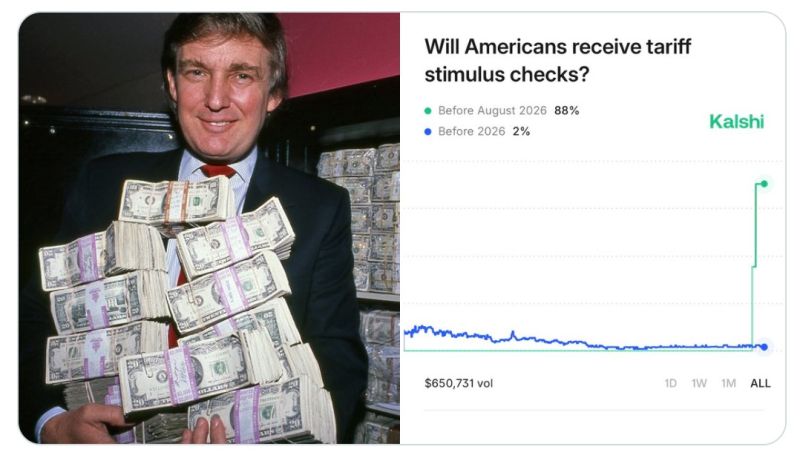
88% chance Americans receive stimulus checks by next summer
Source: Kalshi
Shoppers are showing up for Black Friday–Cyber Monday, but with tighter wallets.
According to Deloitte’s 2025 Black Friday–Cyber Monday survey: 🛍 82% of consumers plan to shop during the week (up from 79% in 2024) 💰 Expected spend is down 4% to an average of $622 💳 64% plan to use credit cards or buy now, pay later (BNPL) options to stretch budgets Both lower- and higher-income households say they’ll cut back It’s also now a true hybrid event: Shoppers expect to split their time 60% online / 40% in store 72% of Gen Z plan to shop in store on Black Friday Gen Z now drives about $20 of every $100 in holiday spend (vs. $4 five years ago) source : Deloitte
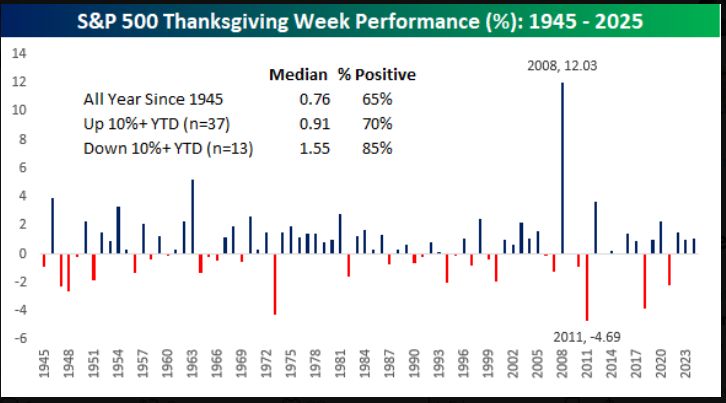
It may be a short week, but Thanksgiving week has traditionally been good for equities.
source : bespoke
Fed Rate-cut odds for December are on the rise...
Hopes of another rate cut in December were initially boosted by Fed's Williams dovish comments on Friday and then encouraged by Goldman over the weekend. Yesterday, San Francisco Fed's Daly added to the sudden dovish pivot (from the rampant hawkish pivot mid-last week): "On the labor market, I don't feel as confident we can get ahead of it," she said in an interview on Monday. "It's vulnerable enough now that the risk is it'll have a nonlinear change." An inflation breakout, by contrast, is a lower risk given how tariff-driven cost increases have been more muted than anticipated earlier this year, she said. Daly's comments pushed the odds of a December cut back above 80%... Source: zerohedge, Bloomberg
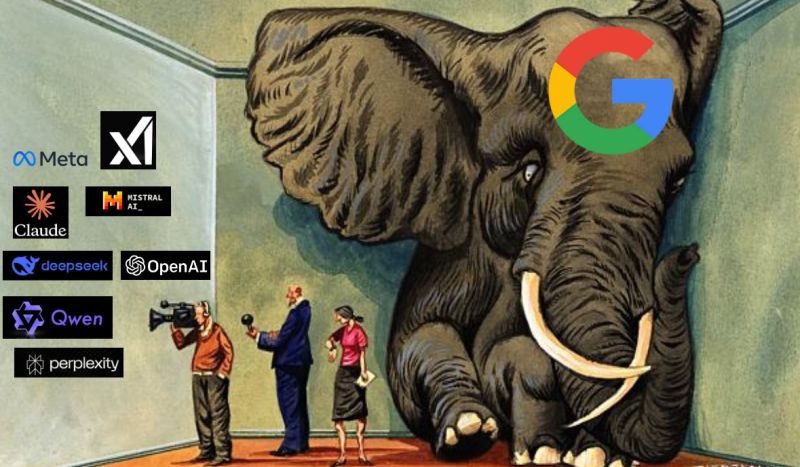
TPU > GPU ???
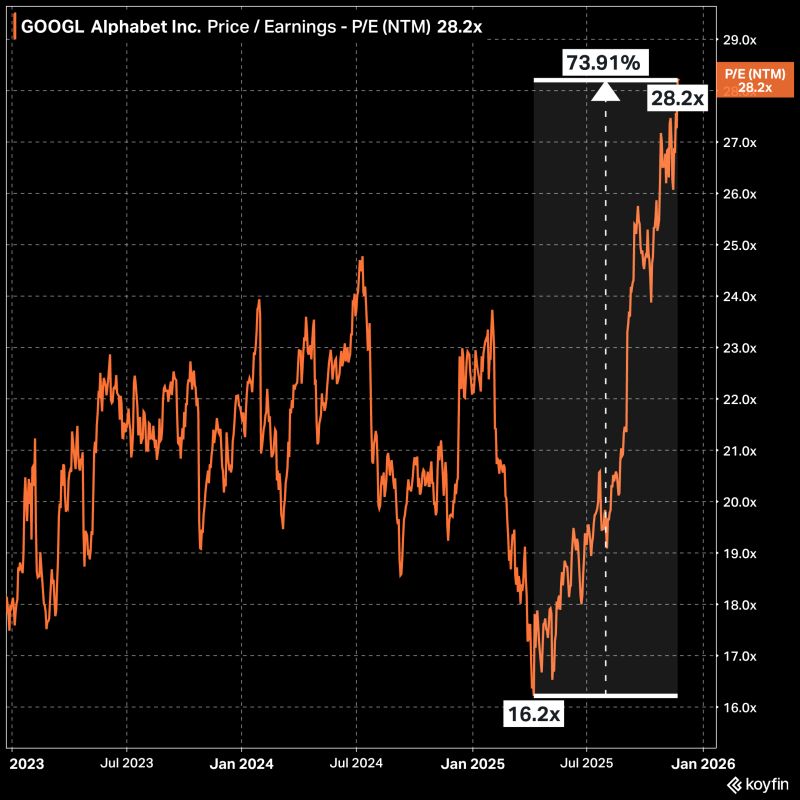
Google's AI chips - TPUs, or tensor processing units - are having a moment. These semiconductors were used to train its latest genAI model, Gemini 3, which has received rave reviews, and are cheaper to use than Nvidia's offerings. 🚀 But here's the real reason Google invented the TPU Back in 2013, Google ran a simple forecast that scared everyone: If every Android user used voice search for just 3 minutes a day, Google would need to double its global data centers. Not because of videos. Not because of storage. But because AI was too expensive to run on normal chips. So Google made a bold move: 👉 Build its own AI chip - the TPU. 15 months later, it was already powering Google Maps, Photos, and Translate… long before the public even knew it existed. ⚡ Why TPUs Matter GPUs are great, but they were built for video games, not AI. TPUs were built only for AI. No extra baggage. No wasted energy. Just raw efficiency and speed. That focus paid off: TPUs deliver better performance per dollar Use less energy Are faster for many AI tasks And with each generation, Google doubles performance Even Nvidia’s CEO, Jensen Huang, openly respects Google’s TPU program. 🤔 Then why don’t more companies use TPUs? Simple: Most engineers grew up with Nvidia + CUDA, and TPUs only run on Google Cloud. Switching ecosystems is hard — even if the tech is better. ☁️ The Bigger Picture: Google’s Cloud Advantage AI is crushing cloud margins because everyone depends on Nvidia. Google isn’t. It owns the chip and the software stack. That means: ✔️ lower costs ✔️ better margins ✔️ faster innovation ✔️ and a defensible advantage competitors can’t easily copy Some experts now say TPUs are as good as or even better than Nvidia’s best chips. 🔥 The Punchline Google didn’t build TPUs to sell chips. It built them to survive its own AI growth. Today, TPUs might be Google Cloud’s biggest competitive weapon for the next decade. And the moment Google fully opens them to the world? The AI infrastructure game changes. Source: zerohedge, uncoveralpha
Investing with intelligence
Our latest research, commentary and market outlooks


