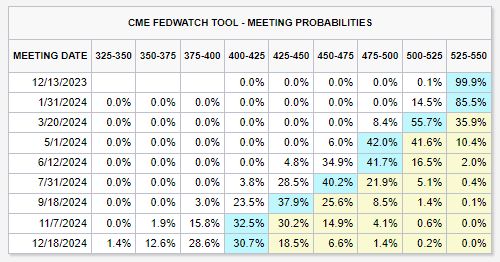
Odds of rate cuts beginning as soon as January 2024 are rising quickly
There is now a ~15% chance of rate cuts beginning next month. The base case shows a ~56% chance of rate cuts beginning in March 2024. Markets are currently expecting a total of FIVE 25 basis point rate cuts in 2024. Still, the Fed has yet to discuss the possibility of any rate cuts at all. Markets are fully bought in to the "Fed pivot." We believe that the economy will continue to slow down and that rate cuts will take place next year. However, a lot pof these cuts are already priced in. This could generate some volatility for bonds and stocks in case of disappoinment (aka macro data surprising on the upside). Source: The Kobeissi Letter
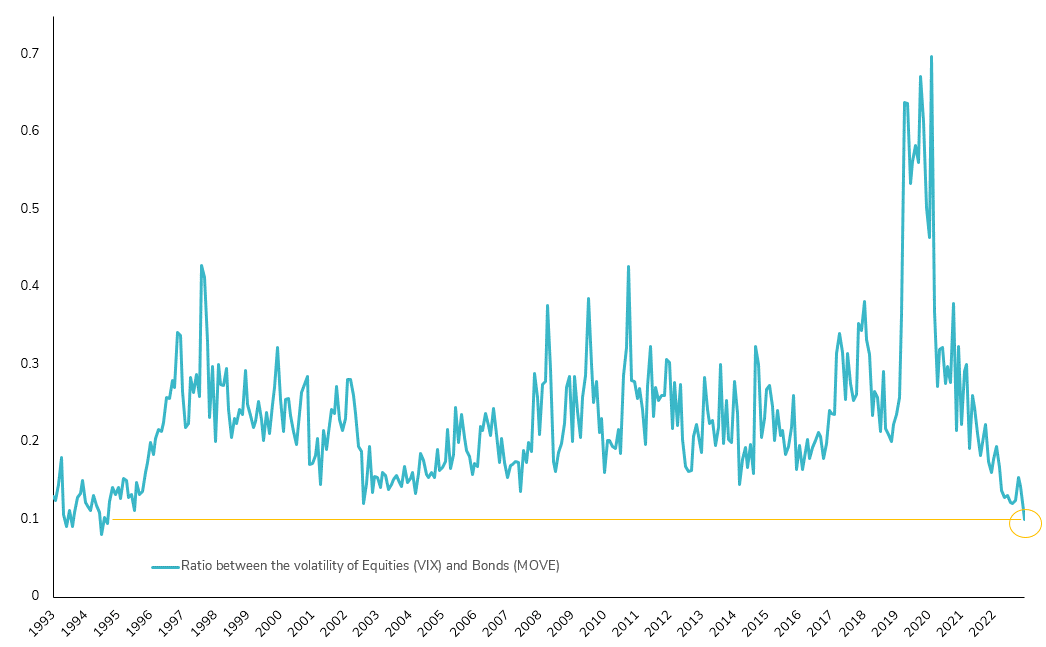
Record Low: Equity/Bonds Volatility Ratio Hits Unprecedented Levels!
The divergence between two widely recognized measures of volatility, the VIX index for Equity and the MOVE index for Rates, continues to be stark. In the U.S., equity volatility has reached new lows for 2023, while volatility in U.S. Treasuries remains persistently high. Calculating the ratio between the VIX and MOVE indexes reveals a significant trend—the lowest point since 1994/1995! Anticipate dynamic shifts in 2024! 📈 #MarketTrends #VolatilityAnalysis #Outlook2024
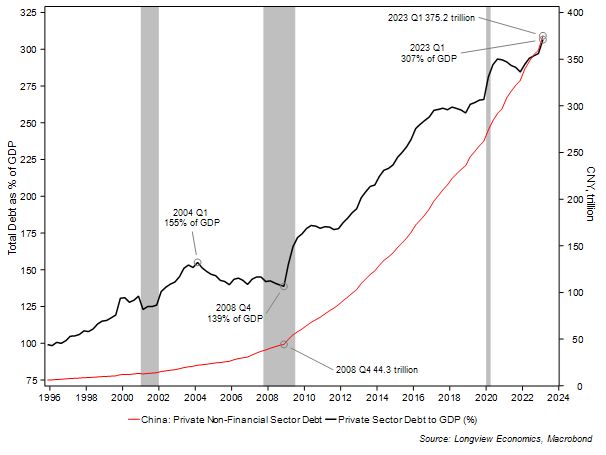
Chinese total private sector debt (level and relative to GDP). This helps explain why Moody's downgraded China's credit rating today...
Source: Longview Economics
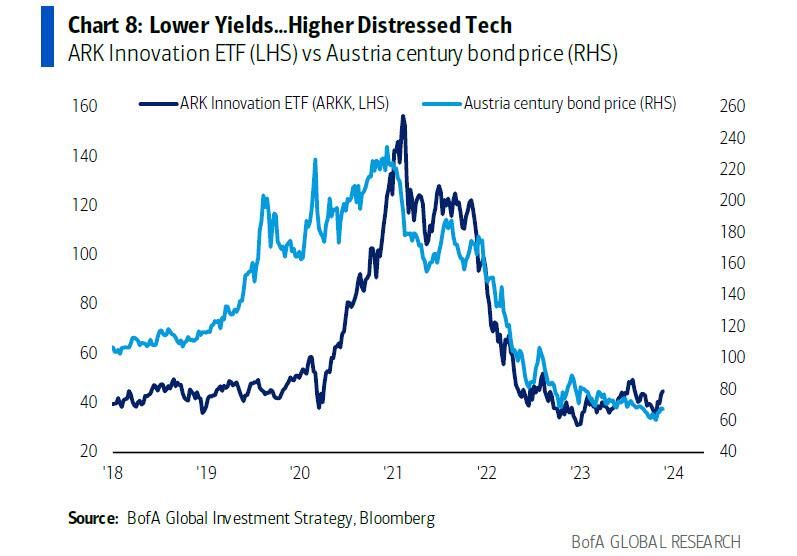
A BofA report shows the remarkable correlation between the Austria government 100-year bond and Ark Invest Innovation ETF
Their point: if bond yields are going "tactically" lower, "distressed tech" is set for a big rally... Source: BofA, www.zerohedge.com
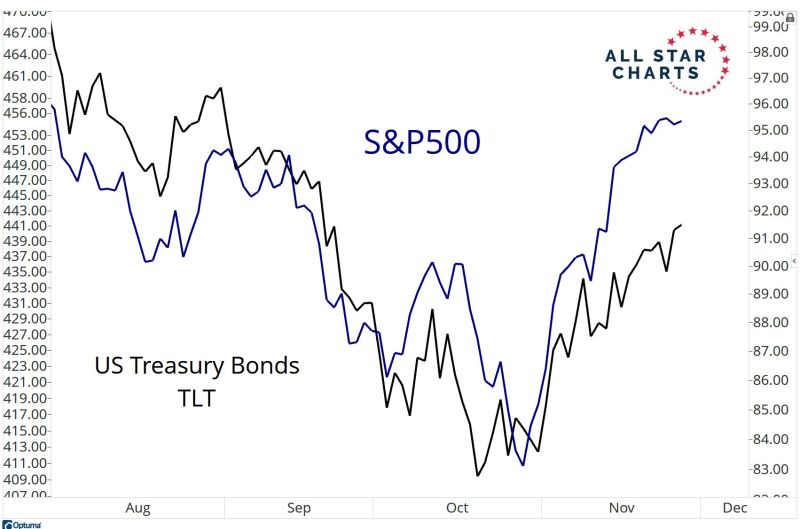
This chart shows that correlation between stocks and long duration bonds remain quite high
This is a regime change from previous decade and has implications for portfolio construction. Source: J-C Parets
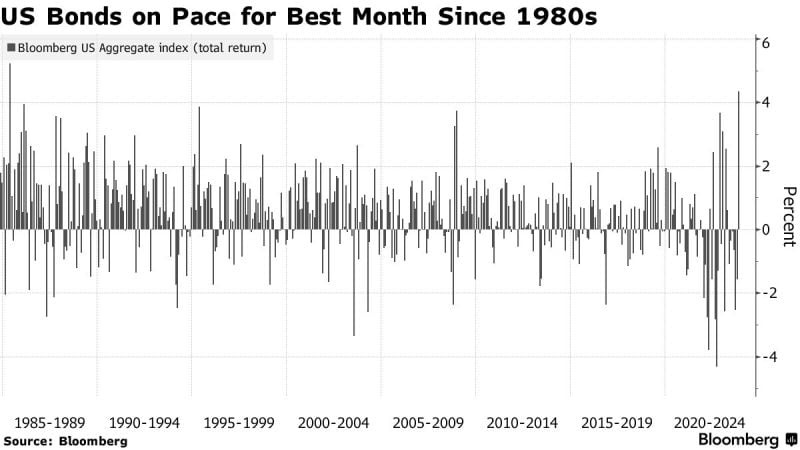
Bond Market's Best Month Since 1980s Sparks Cross-Asset Rally
In a year in which little has gone right in the US bond market, November turned out to be a month for the record books. Investors frantically bid up the price of Treasuries, agency and mortgage debt, sparking the best month since the 1980s and igniting a powerful pan-markets rally in everything from stocks to credit to emerging markets. Source: Bloomberg
Per Bloomberg, US Treasury issuance next year is expected to reach $1.9 trillion...
Excess supply of US Treasuries remains a key downside risk for bonds (and thus for equities given the still high correlation between the 2). Note that every Treasury auction is now very closely monitored by investors with some immediate consequences on market returns (e.g last week: strong auction triggered a drop in US Treasury yields on Wednesday and a rise in sp500). Source picture: Markets Mayhem

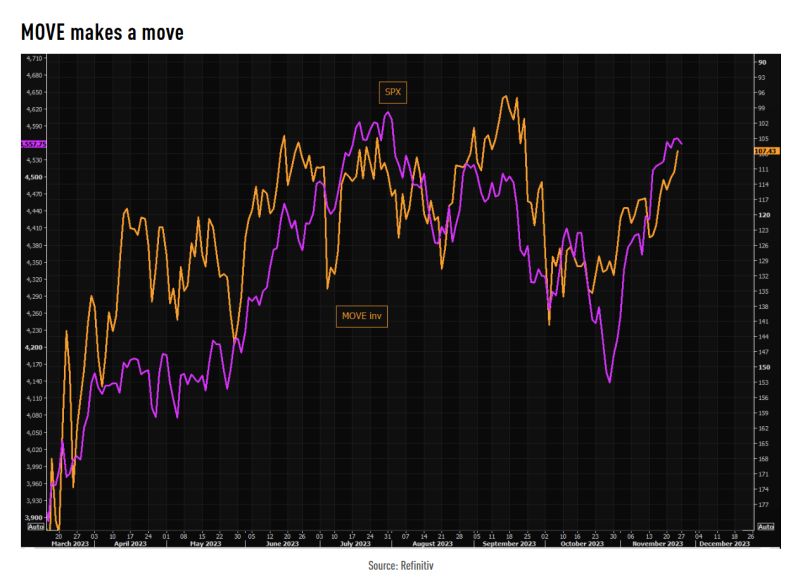
EQUITIES MOVE HIGHER AS BOND VOLALITY DROPS
Rates volatility joined the global volatility puke in November and we actually have the MOVE trading at the lowest levels since around mid September. Perfection vs SPX continues. Chart shows MOVE inverted vs SPX. Source: TME