Straight from the Desk
Syz the moment
Live feeds, charts, breaking stories, all day long.
- All
- us
- equities
- Food for Thoughts
- macro
- sp500
- Bonds
- Asia
- bitcoin
- Central banks
- markets
- technical analysis
- investing
- inflation
- europe
- Crypto
- interest-rates
- Commodities
- geopolitics
- performance
- gold
- ETF
- nvidia
- tech
- AI
- earnings
- Forex
- Real Estate
- oil
- bank
- FederalReserve
- Volatility
- apple
- nasdaq
- emerging-markets
- magnificent-7
- energy
- Alternatives
- switzerland
- trading
- tesla
- sentiment
- Money Market
- russia
- France
- UK
- assetmanagement
- ESG
- Middle East
- china
- amazon
- ethereum
- microsoft
- meta
- bankruptcy
- Industrial-production
- Turkey
- Healthcare
- Global Markets Outlook
- recession
- africa
- brics
- Market Outlook
- Yields
- Focus
- shipping
- wages
Long-Term Bond Prices Hitting Historic Lows in Global Aggregate Bonds Index: A Cautionary Tale of Convexity?
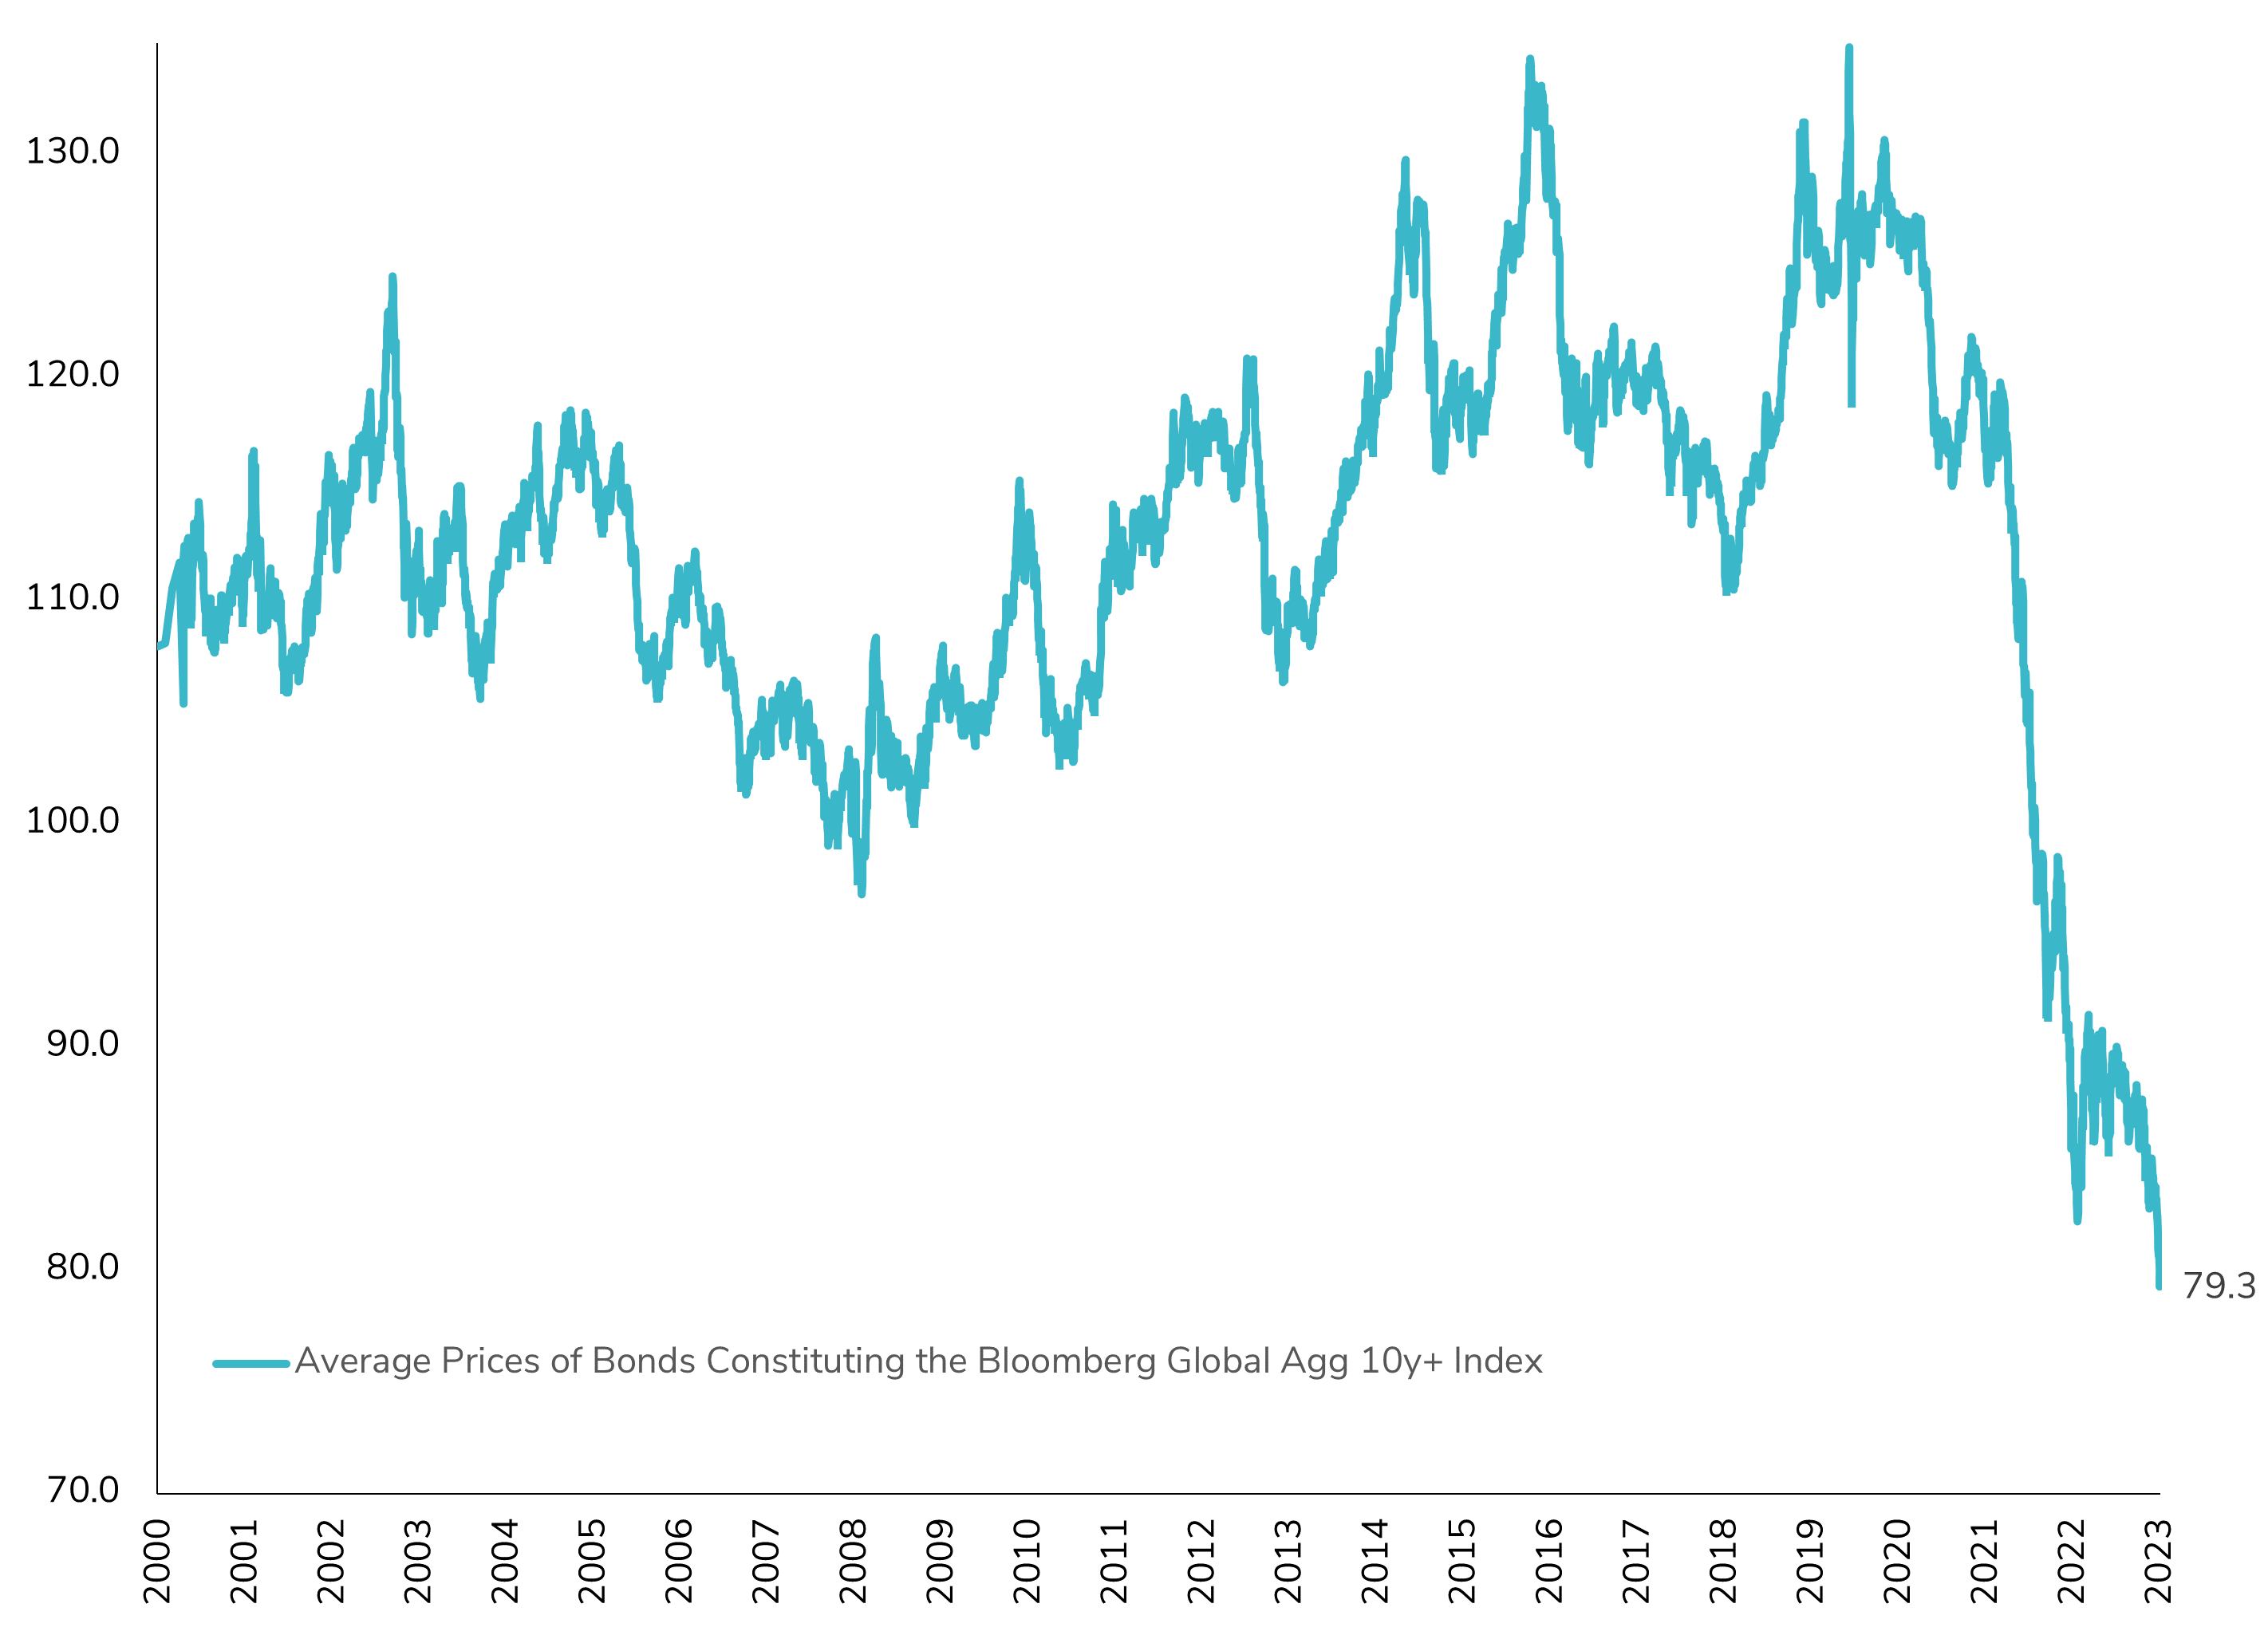
The average price of long-term bonds has recently reached historic lows, a significant development since the inception of the Bloomberg Global Aggregate Bonds Index in the early 2000s. If the "higher for longer" narrative materializes and persists, it carries substantial implications for bond investors, especially those with long-term bond holdings. This pertains to the convexity of long-term bonds, a crucial yet often underestimated aspect of fixed-income investments. Choosing to retain long-term bonds with reduced prices and the associated lower coupon payments may lead to overlooking the attractiveness of short-term bonds, which currently offer more technically appealing yields. This decision could potentially entail a nuanced opportunity cost in the short term, especially if the 'higher for longer' scenario (which implies a soft landing) persists. Source : Bloomberg
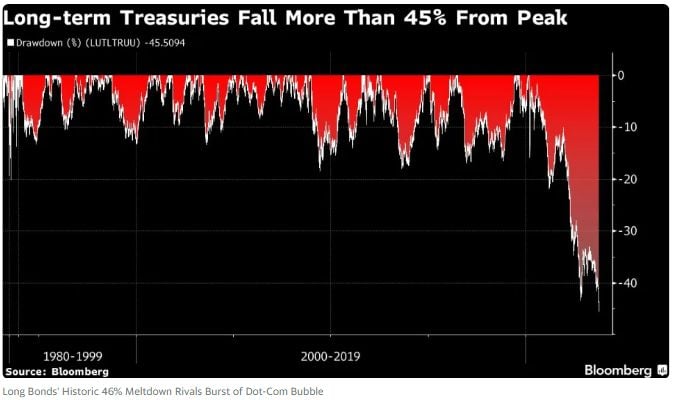
10-Year Treasuries have declined 46% from the peak in March 2020 which is among the greatest meltdowns in financial history including the 49% drop in equities during the Dotcom Bubble
Source: Bloomberg, Barchart
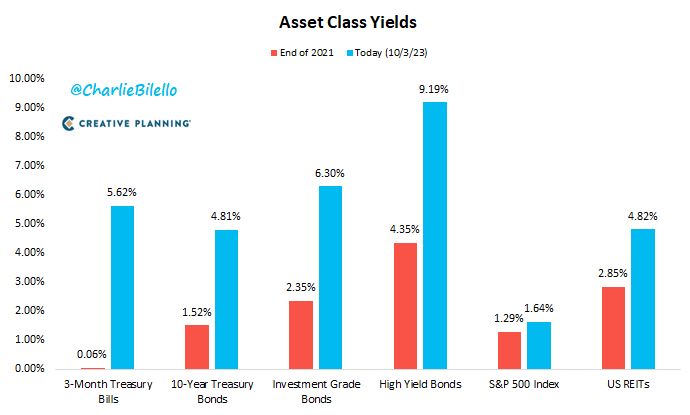
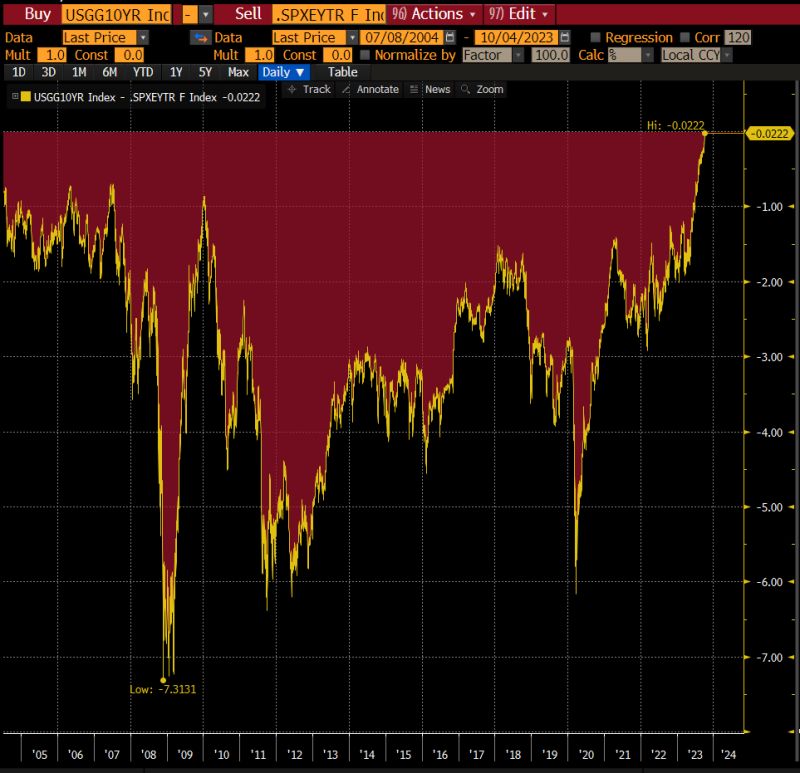
Yields on 10-year Treasuries are now almost equal to the trailing 12-month earnings yield on the S&P 500 index. This is the first time that's the case going back to 2002
Source: Bloomberg, Lisa Abramowitz
Reminiscence of 1987 crash?
Carl Quintanilla posted: “When I started in the business in 1987,” reminisces Steve Sosnick of Interactive Brokers, “bonds were mired in a bear market for most of the year while stocks rallied sharply. Until, of course, that reversed ..” John Authers Comparison for bond yields bear a scarily unwelcome resemblance to 36 years ago -> Source chart: Bloomberg
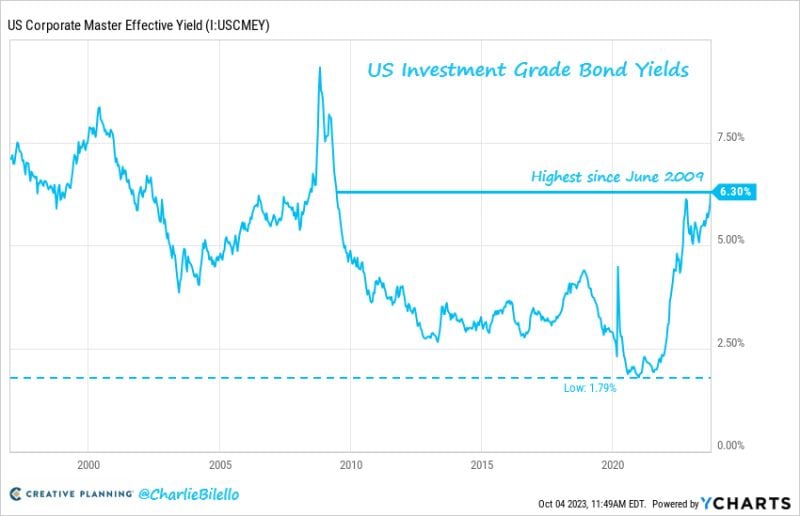
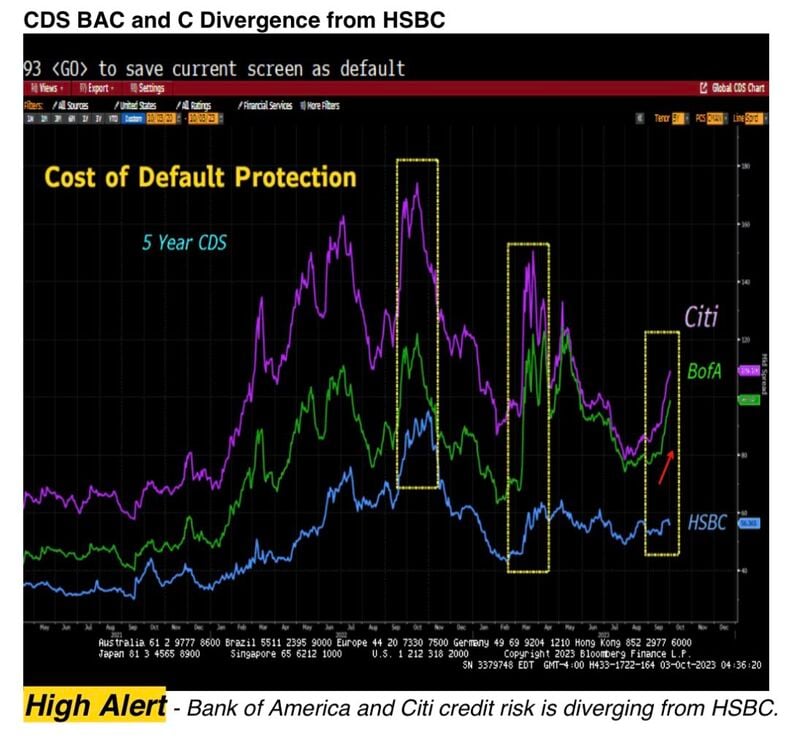
Rising bond yields is hurting US banks and it starts to show up in the CDS- see below.
With US Treasuries at 5%, Bank of America is close to 45x levered, at 6-7% infinitely levered. Maybe the Fed should have stress-tested the banks not only on credit quality but also duration... Source: Lawrence McDonald
Investing with intelligence
Our latest research, commentary and market outlooks


