WHAT A SHORT SQUEEZE...
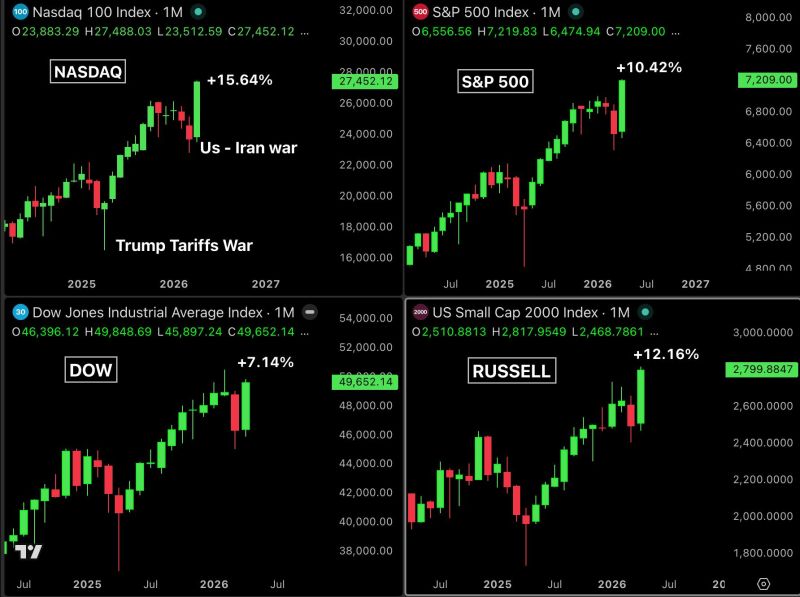
On April 1st, the US-Iran war was in full swing, oil was at $115, the Strait of Hormuz was closed, recession fears were everywhere, and hedge funds were at their most bearish positioning in years. Every major bank was warning of a market crash. Then the ceasefire hit. Oil crashed 22% and Every hedge fund that was short had to cover immediately. Every investor sitting in cash had to chase the rally. The result: - Nasdaq: +16% in April, New all time high. - S&P 500: +11% in April, New all time high. - Russell 2000: +12% in April, New all time high. - Dow Jones: +7% in April. Three major indexes hitting all time highs in the same month while an active war was happening is something that has almost never occurred in market history. Source: Bull Theory
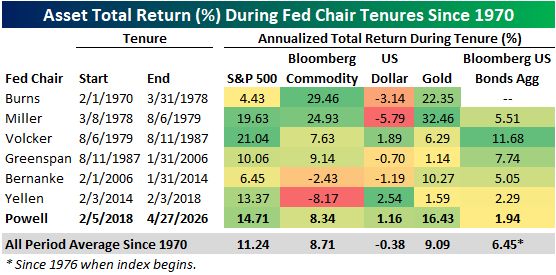
The S&P gained 14.7% annualized during Powell's tenure; third best for Fed chairs since 1970
Source: Bespoke
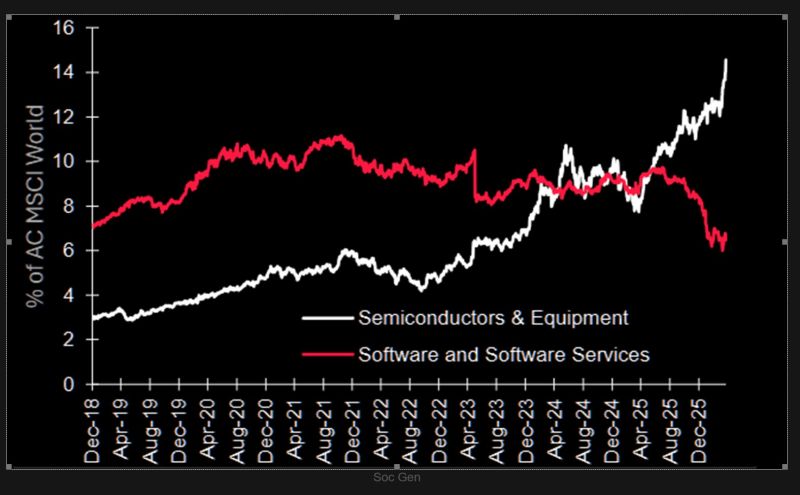
Semiconductors now represent almost 15% of AC MSCI World market capitalisation and are now the largest sector overall.
Source: SocGen, TME
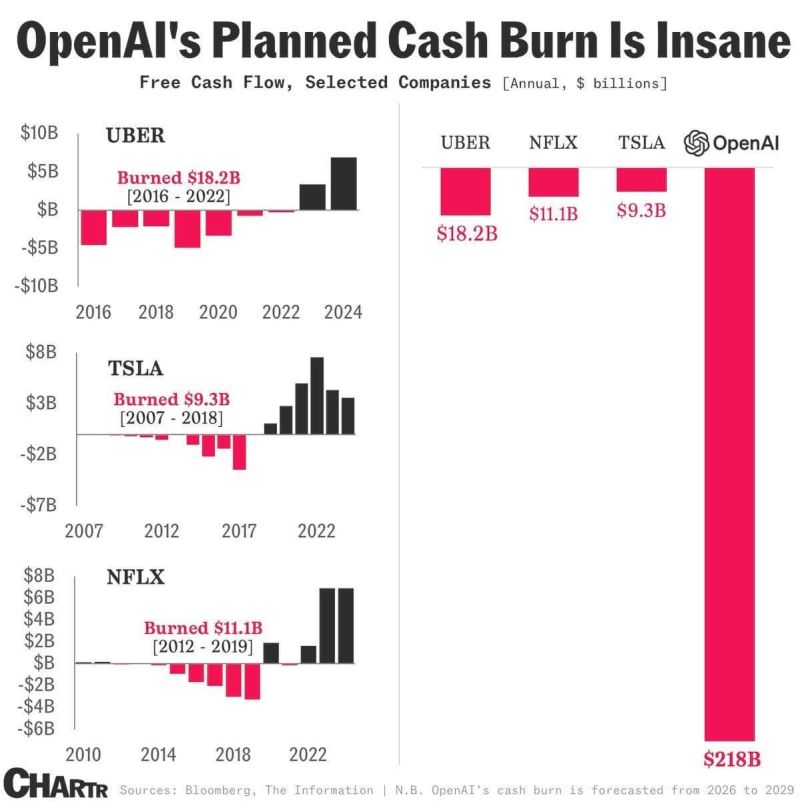
The cracks inside OpenAI are deepeningn and the numbers don’t lie. When your own CFO raises concerns, it’s a serious signal.
Here’s what is happening: missed user and revenue targets, while ChatGPT rapidly loses share to Google’s Gemini. Sarah Friar has reportedly warned about funding future compute and pushed back on Sam Altman’s aggressive IPO timeline. Meanwhile, massive data center commitments could burn hundreds of billions before profitability, even after record fundraising. Now the board is questioning spending, and legal pressure from Elon Musk is building. A company valued at $852B—but facing real financial and strategic risks. Source: The Assembly; Chartr
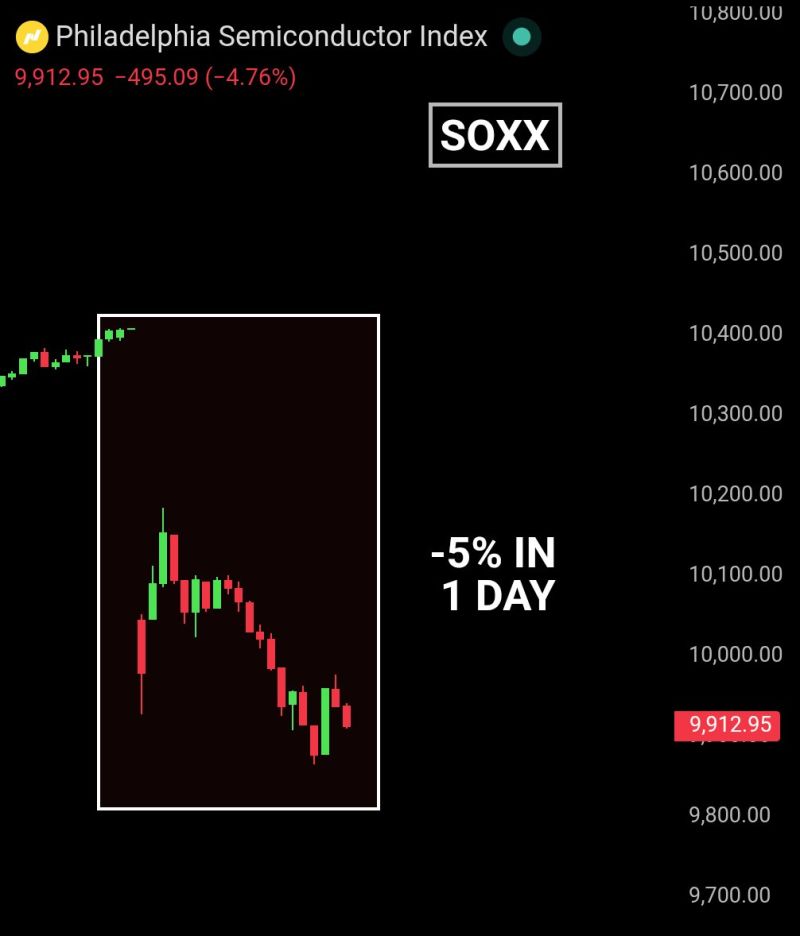
$440 billion wiped from semiconductor stocks in a single day after 19 straight days of gains.
The $SOX Semiconductor Index crashed 5% on Tuesday, its worst session in months and the first red day after the longest winning streak in the index's history. - $NVDA down 3.2% wiping out $200 billion. - $AVGO down 4.3% wiping out $95 billion. - $MU down 5.8% wiping out $40 billion. - $AMD down 4.8% wiping out $29 billion. - $INTC down 4.2% wiping out $7 billion. Source: Bull Theory
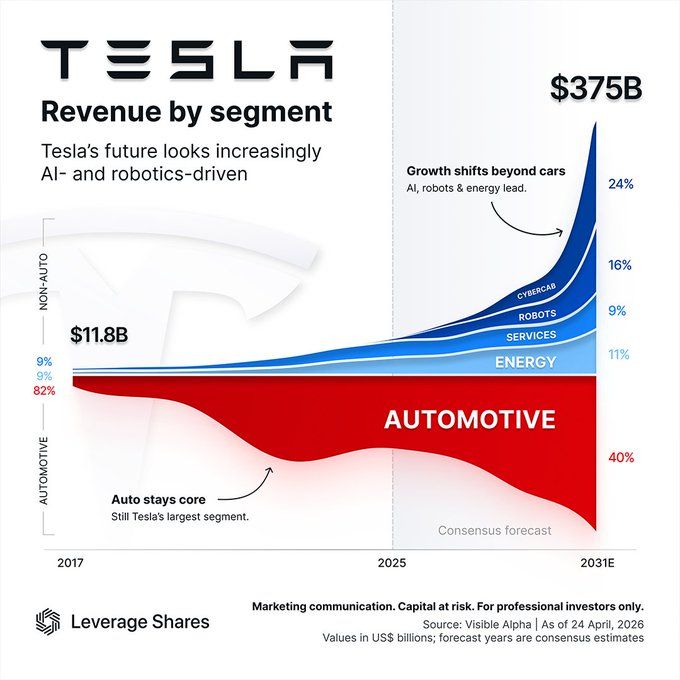
Tesla $TSLA is positioning itself to be the largest physical AI deployment platform by the end of this decade.
By 2031, Tesla could become a $375B revenue story where AI, robots, services, energy & Cybercab together become larger than automotive: • Automotive 40% • Cybercab 24% • Robots 16% • Energy 11% • Services 9% Source: Shay Boloor
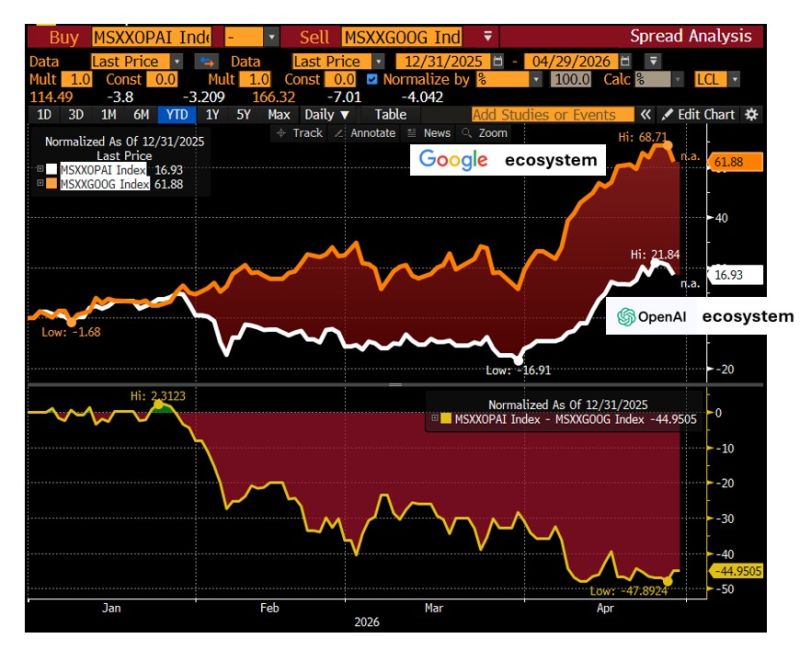
Yesterday was all about the OpenAi missed targets story. OpenAi ecosystem has underperformed the Google AI ecosystem (-45%) aggressively since the end of January.
Source: RBC, Bloomberg
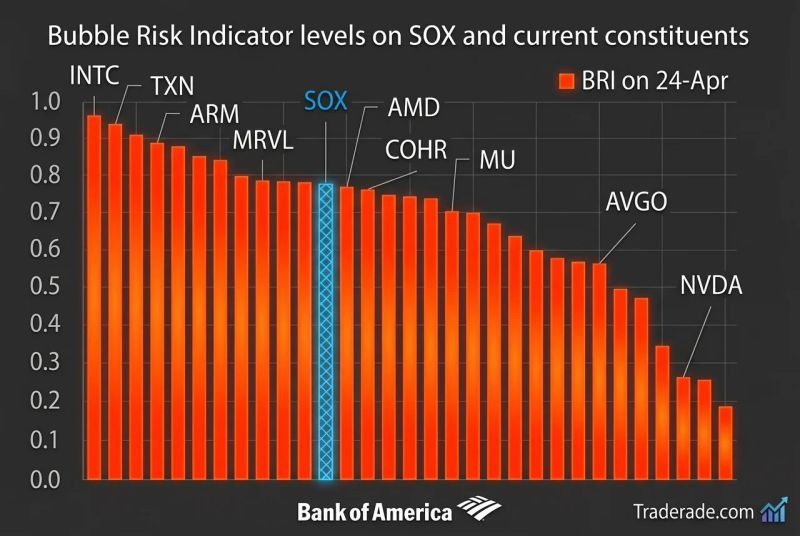
Almost half of the semiconductor index names are showing Bubble Risk Indicator levels above 0.8, and two thirds above 0.7, according to Bank of America.
Source: Markets & Mayhem