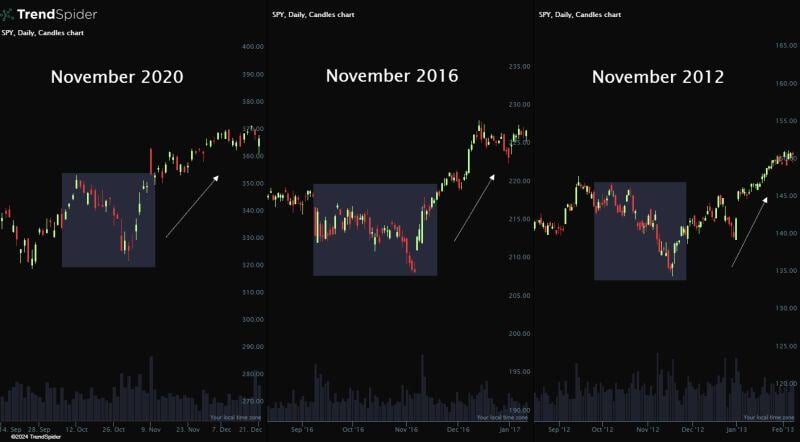
$SPY Price Action Around Elections
In the last three election cycles, we've seen risk-off behaviour before the vote, followed by a strong rally in the weeks that follow. This year’s pattern is shaping up similarly, will history repeat? Source: TrendSpider @TrendSpider
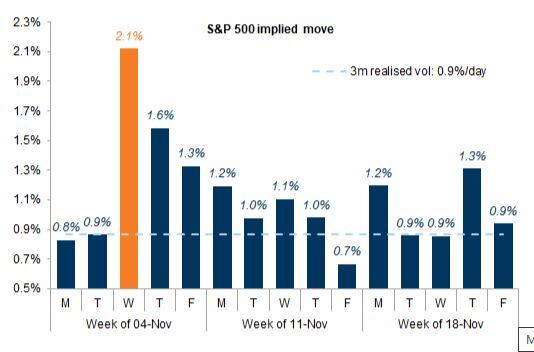
Markets are pricing a large move on Nov. 6th
Source: Mike Zaccardi, CFA, CMT 🍖@MikeZaccardi
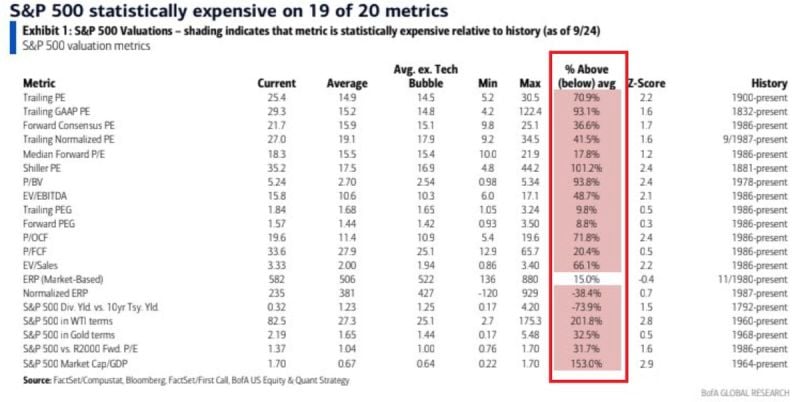
🚨THIS IS ONE OF THE MOST OVERVALUED MARKETS IN HISTORY🚨
S&P 500 is expensive on 19 out of 20 metrics, according to the Bank of America analysis. Some metrics such as Shiller Price to Earnings ratio (CAPE) are over 100% above historical averages Source: Global Markets Investor
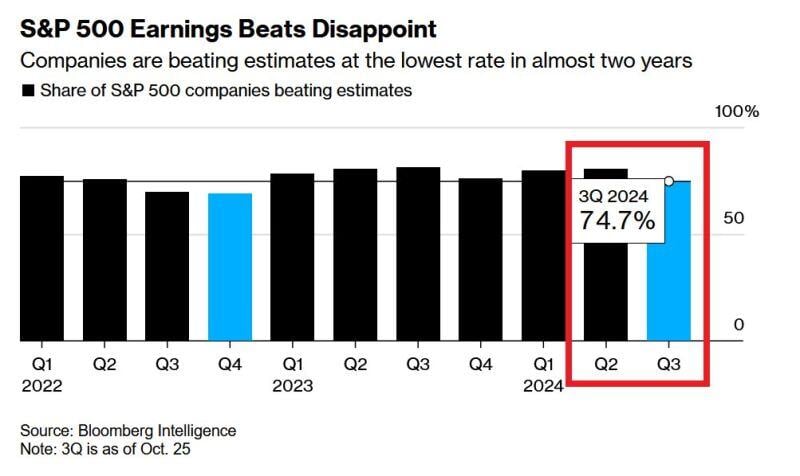
⌛ S&P 500 EARNINGS HAVE BEEN DISAPPOINTING⌛
75% of companies beat Wall Street analysts' Q3 earnings expectations, the lowest share since Q4 2022. This is despite huge earnings estimates downgrades that took place in Sep This week will be extremely crucial as 42% firms report. Source. Global Markets Investor, Bloomberg
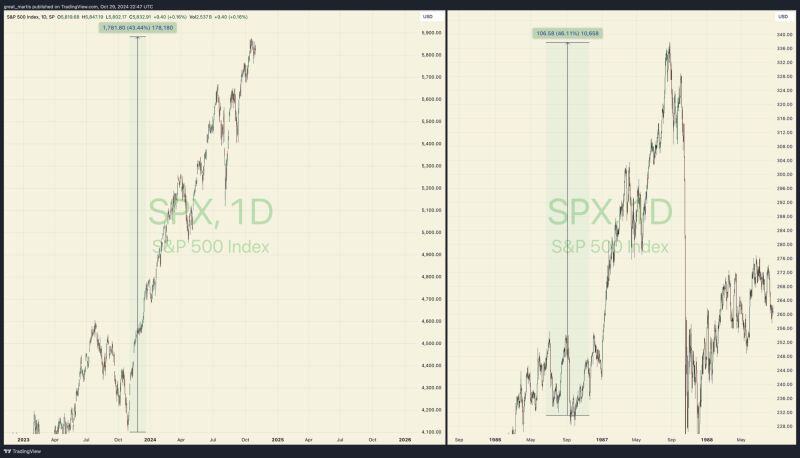
The last time the S&P 500 rose more than 40% over 12 months was in 1987.
Source: The Great Martis @great_martis
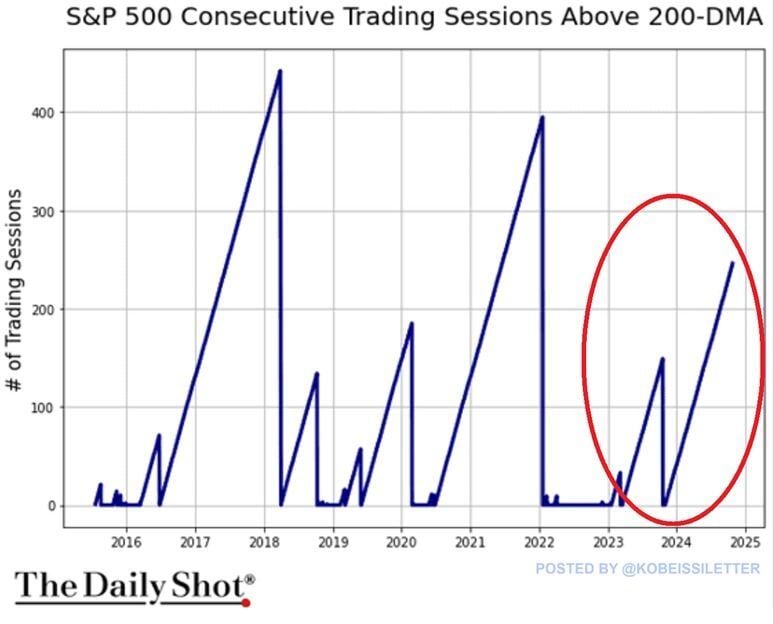
This is one of the most resilient stock market in history:
The S&P 500 has been trading above its 200-day moving average for 247 straight sessions, the third-longest streak in 8 years. The previous 2 records were posted in 2016-2018 and 2020-2021 which lasted for 430 and 400 trading days, respectively. Over the last 12 months, the S&P 500 is now up over 40%, marking the 4th best 12-month performance this century. There have been only three other occurrences since 2000 when the index rallied at least 39% year-over-year: 2004, 2010, and 2021. To put this into perspective, the S&P 500's average annual return since 1957 has been ~10%. Source: The Kobeissi Letter, The Daily Shot
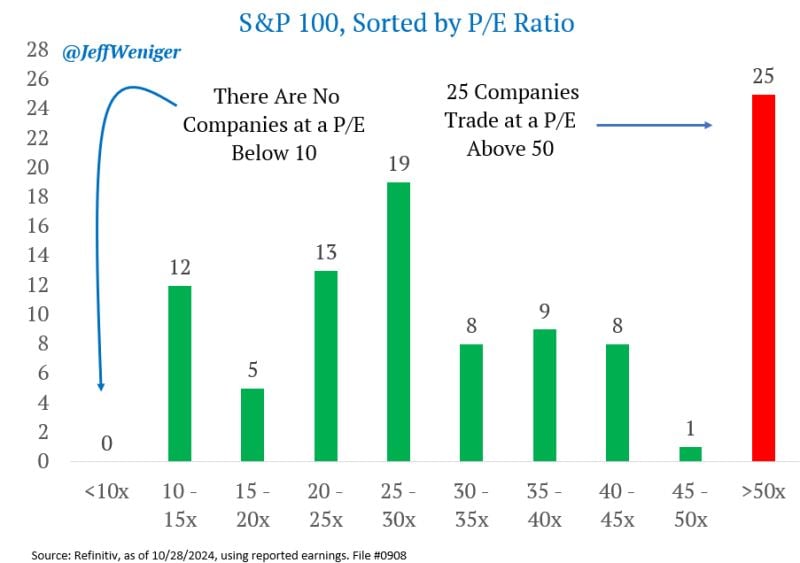
Of the 100 largest companies (the S&P 100), there are 25 who are trading for more than 50x reported earnings.
Meantime, there are zero companies trading for less than 10x earnings. Source: Jeff Weniger
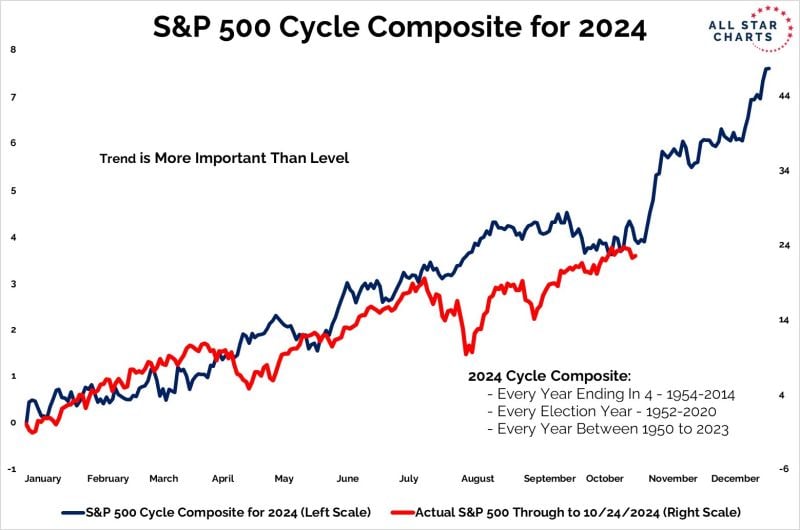
As the market has now fully priced in a second trump presidency, the S&P500 is about to enter the best 3 month period of the year: November - January.
Below is the cycle composite for the SP500... (The trend is more important than the level). Source: J-C Parets