Straight from the Desk
Syz the moment
Live feeds, charts, breaking stories, all day long.
- All
- us
- equities
- Food for Thoughts
- macro
- Bonds
- sp500
- Asia
- Central banks
- markets
- bitcoin
- technical analysis
- investing
- inflation
- interest-rates
- europe
- Crypto
- Commodities
- geopolitics
- performance
- ETF
- gold
- AI
- nvidia
- tech
- earnings
- Forex
- Real Estate
- oil
- bank
- Volatility
- FederalReserve
- nasdaq
- apple
- emerging-markets
- magnificent-7
- Alternatives
- energy
- switzerland
- sentiment
- trading
- tesla
- Money Market
- russia
- France
- ESG
- UK
- assetmanagement
- Middle East
- microsoft
- ethereum
- meta
- amazon
- bankruptcy
- Industrial-production
- Turkey
- china
- Healthcare
- Global Markets Outlook
- recession
- africa
- brics
- Market Outlook
- Yields
- Focus
- shipping
- wages
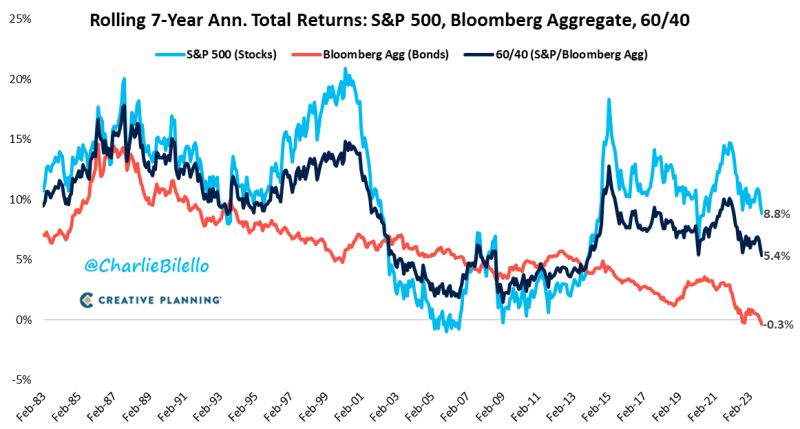
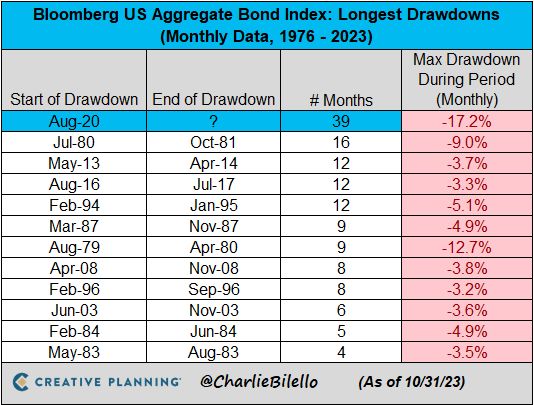
Annualized Total Returns over the last 7 years...
US Stocks: +8.8% US Bonds: -0.3% US 60/40: +5.4% Source: Charlie Bilello
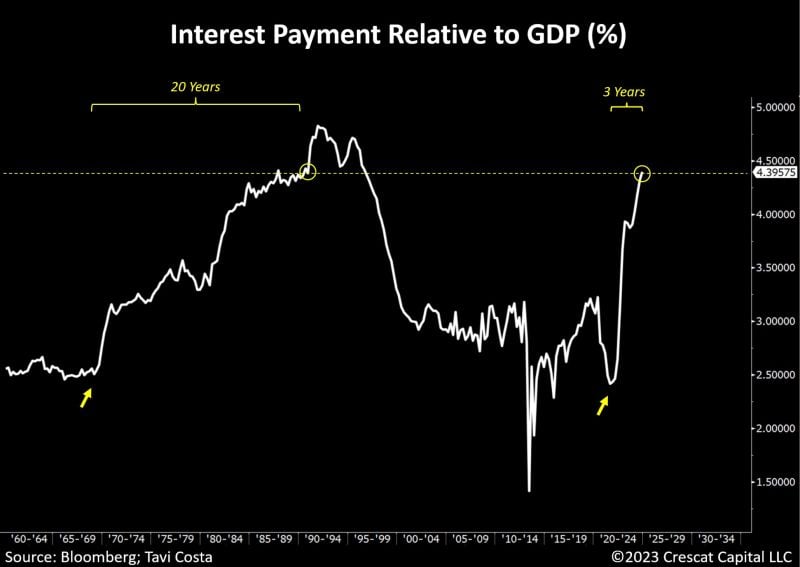
It took 20 years for US interest payments to reach 4.5% of GDP in the 1970s and 80s
Today, achieving the same level will take less than 3 years. This starkly highlights the speed of the rise in Treasury yields and the magnitude of the debt problem. Source: Tavi Costa, Bloomberg
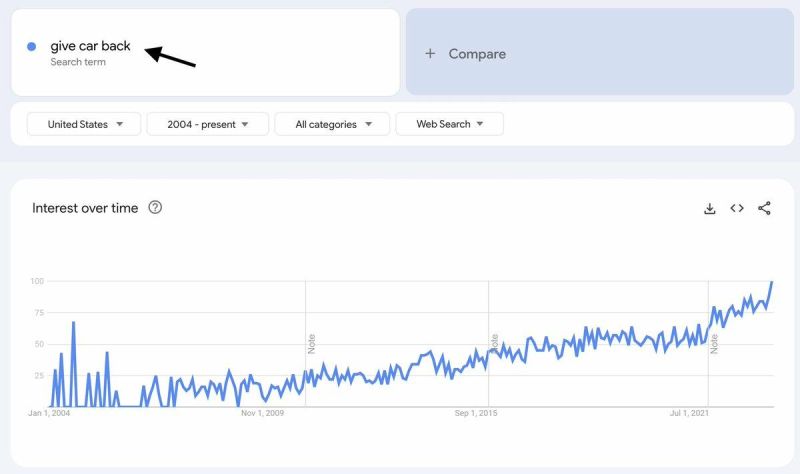
Americans Panic Search "Give Car Back" As Subprime Auto Loan Delinquency Erupts
Recent data from Edmunds reveals that an unprecedented 17% of American car purchasers now have monthly car payments of $1,000, a significant increase from just 7% three years ago. This trend highlights the extent to which consumers, despite being financially stretched, are willing to take on massive auto debt in these uncertain economic times as macroeconomic headwinds pile up. New Google data, first revealed by X user CarDealershipGuy, shows Americans are searching "give car back" on the internet has soared to a record high. Source: Google search
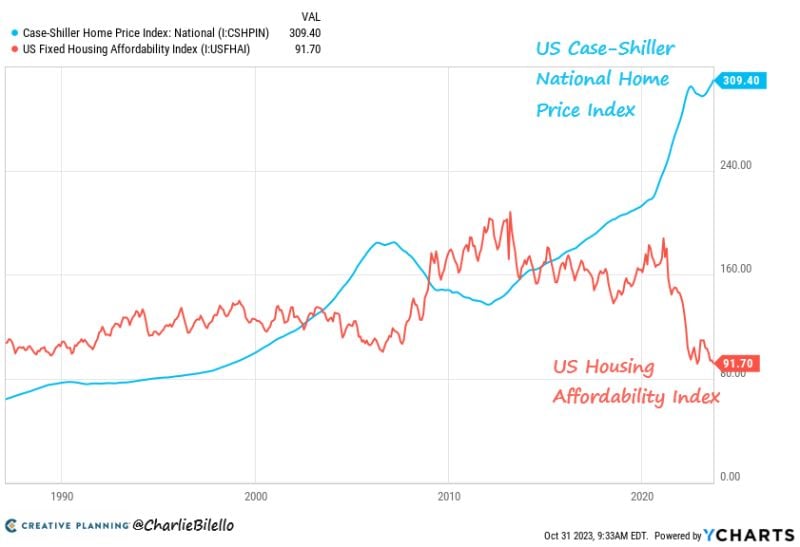
US Home Prices hit a new all-time high in August while affordability has plummeted to record lows...please explain...
Source: Charlie Bilello
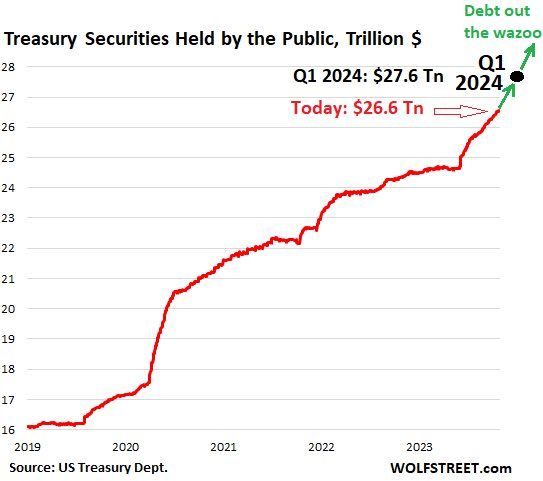
Marketable US Treasury Debt to Explode by $2.85 Trillion in the 10 Months from End of Debt Ceiling to March 31, 2024
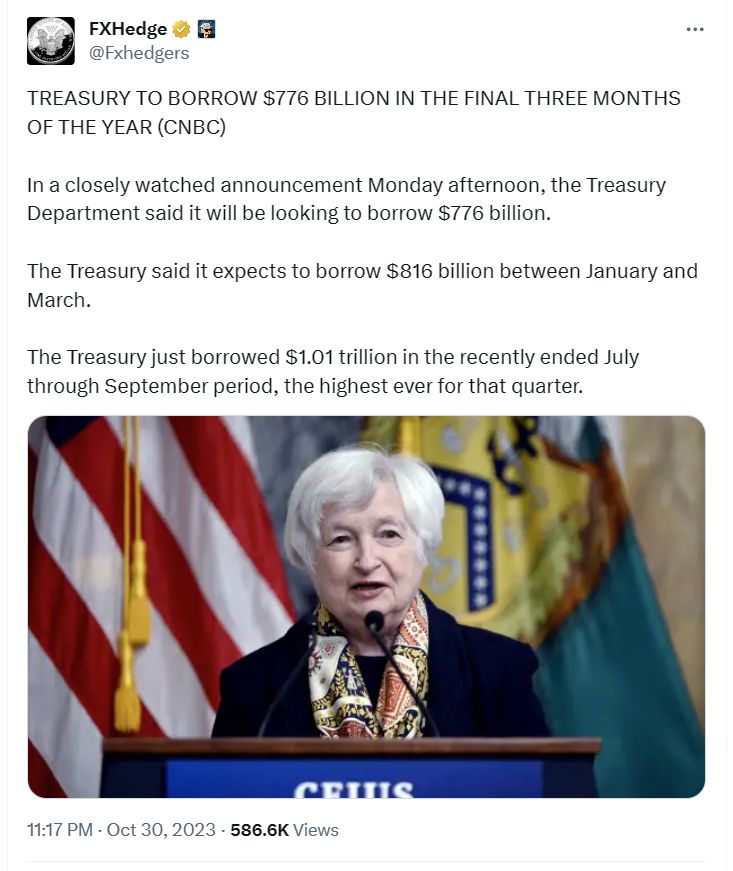
In total, over those two quarters marketable debt will have increased by $1.59 trillion! This follows the $1.01 billion increase in Q3, and the surge in June after the debt ceiling ended. At the beginning of Q4, marketable debt outstanding was $26.04 trillion. The government will add $1.59 trillion to it, pushing it to $27.6 trillion by March 31, 2024. Source: Wolfstreet, WallStreetSilver
Beware the short squeeze... CTAs are now short $25 billion of US equities, one of the largest short positions in the 8 years...
Source: Barchart
Investing with intelligence
Our latest research, commentary and market outlooks


