Straight from the Desk
Syz the moment
Live feeds, charts, breaking stories, all day long.
- All
- us
- equities
- Food for Thoughts
- macro
- sp500
- Bonds
- Asia
- bitcoin
- Central banks
- markets
- technical analysis
- investing
- inflation
- europe
- Crypto
- interest-rates
- Commodities
- geopolitics
- performance
- gold
- ETF
- tech
- nvidia
- AI
- earnings
- Forex
- Real Estate
- oil
- bank
- FederalReserve
- Volatility
- apple
- nasdaq
- emerging-markets
- magnificent-7
- energy
- Alternatives
- switzerland
- trading
- tesla
- sentiment
- Money Market
- russia
- assetmanagement
- France
- UK
- china
- ESG
- Middle East
- amazon
- ethereum
- microsoft
- meta
- bankruptcy
- Industrial-production
- Turkey
- Healthcare
- Global Markets Outlook
- recession
- africa
- brics
- Market Outlook
- Yields
- Focus
- shipping
- wages
As highlighted in a tweet by HolgerZ, the S&P 500 is running in tandem with the Fed net liquidity
So it's not so much the peak or pause in rate hikes that matters, but rather what happens to the Fed balance sheet & reverse repo operations. Source: HolgerZ, Bloomberg
GS Financial conditions index is tightening significantly, now at the tightest since November 2022...
This is probably what the FED wants to see...until something breaks... Source: www.zerohedge.com, Bloomberg
US 10-year Treasury yield is skyrocketing and now at 4.63%, its highest since June 2007
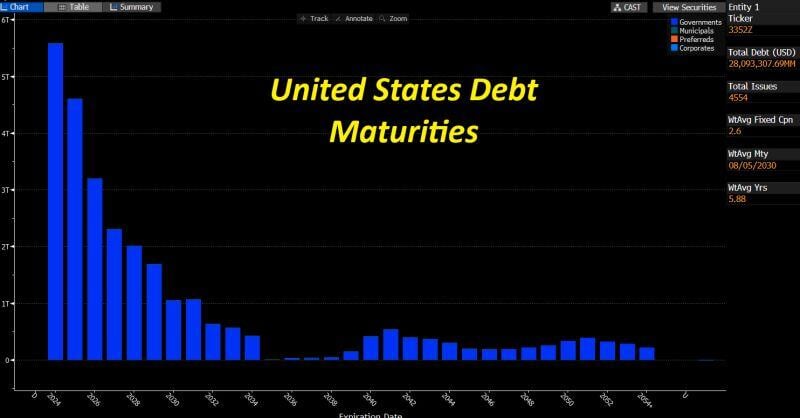
Since last week’s Fed meeting, the 10-year note yield is up 35 basis points. Since the last Fed rate hike in July, the 10-year note yield is up 60 basis points. Meanwhile, Fed rate HIKE expectations have NOT changed. As highlighted by the Kobeissi Letter, odds of another rate hike have actually gone DOWN. But, a long Fed PAUSE is being priced-in now. All as record levels of US Treasuries are being issued while FED balance sheet reduction pace has been accelerating (QT). This bear steepening is pushing the dollar UP and weighing on stocks valuations especially long duration ones, i.e tech darlings. Source. CNBC, The Kobeissi Letter
For The First Time In 13 Years, The Fed Is Cutting Workers As It Books $100 Billion In Losses
The FED has booked $100 billion in losses in recent months on operations that currently involve paying more in interest to banks on reserve deposits at the Fed than the central bank earns from its roughly $7.5 trillion portfolio of bonds and mortgage-backed securities. Source: www.zerohedge.com, Bloomberg
The S&P 500 is now down 340 points, or 7.5%, since the Fed removed a recession from their forecast
On July 26th, the Fed raised rates and said they were not longer expecting a recession. The Fed marked the EXACT high in the S&P 500 which just hit its lowest levels since June. Since then, rate cut expectations were pushed out by a year and corporate bankruptcies hit their highest levels since the pandemic. Is the market losing faith in the Fed again? Source: The Kobeissi Letter
Treasury notes, bonds, and mortgage-back securities account for over 80% of the Federal Reserve's balance sheet
Last week, the Fed's balance sheet plunged by almost $75BN last week, its biggest weekly drop since July 2020. The Fed's balance sheet is now over 10% below its April 2022 peak. But this is WITHOUT taking into account the current drop in value of the bonds held on the balance sheet. Indeed, if they were to be re-evaluated using a mark-to-market methodology, the Fed's assets could be reduced by another $1 trillion. To provide some context, he recent decline in market value would likely exceed the entirety of their QT policy thus far, which accounted for $939B. This would essentially revert their balance sheet size back to 2020 levels. Source: Bloomberg, Tavi Costa
Do you remember what Larry Summers said last year about soft landing?
This story of second marriage and the triumph of hope vs. experience seems to find an echo at the FED level...
According to Bloomberg chief economist Anna Wong, online betting markets see a 69% chance of a federal government shutdown starting Oct. 1st
So what could be the effects on the US economy and job market? Below chart shows the effects on GDP depending on the duration of the shutdown. - According to Goldman, a government-wide shutdown would reduce quarterly annualized growth by around 0.2% for each week it lasted after accounting for modest private sector effects. Goldman's baseline is that a shutdown could last for 2-3 weeks (the Trump government shutdown, the longest in history, lasted 35 days, from Dec 22, 2018 to Jan 25, 2019). - Meanwhile, Bloomberg also speculates that in an extreme tail event, the maximum hit to 4Q GDP would be a drag of 2.8% if the shutdown lasts for the entire quarter. Source: Goldman Sachs, Bloomberg, www.zerohedge.com
Investing with intelligence
Our latest research, commentary and market outlooks