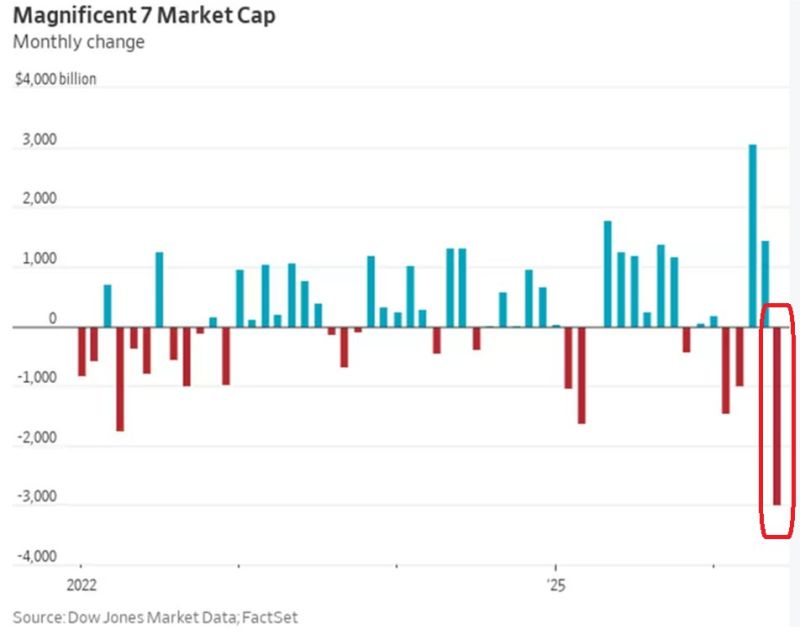
The Magnificent 7 just lost nearly $3 TRILLION in market value.
June is shaping up to be their worst month on record. The Roundhill Magnificent Seven ETF ($MAGS) has plunged -12.9% month-to-date, including -5.9% this week alone. But this isn't just another tech selloff. Apple has raised MacBook prices. Microsoft has increased Xbox prices. Both point to the same culprit: rising memory costs driven by the AI infrastructure boom. For the first time, AI CapEx is flowing through the entire value chain and showing up in consumer prices. Now investors are asking a different question How long will markets keep rewarding record AI spending before demanding stronger returns? If confidence fades, the market won't just reprice Big Tech. It will start pricing in AI CapEx cuts. That would lower growth expectations for hyperscalers, hit semiconductor demand, and could trigger a much broader market selloff. The AI trade has been built on ever-higher investment. What happens if Wall Street starts expecting less? This is a key downside risk to monitor. Which also means that you need to be broadly diversified. Source: Dow Jones, Global Markets Investors
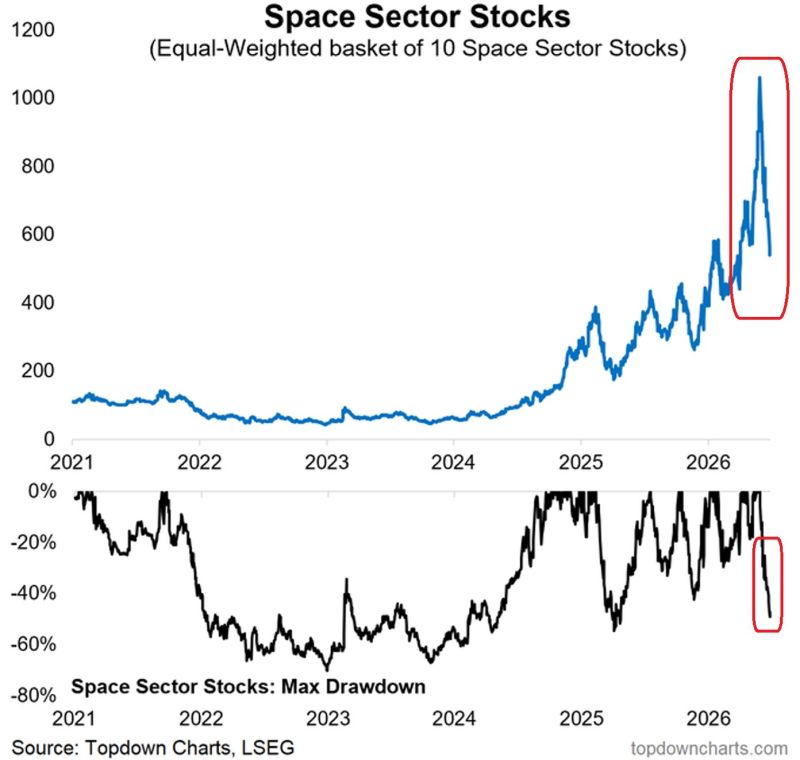
Stairs up, ELEVATOR down in US space stocks:
The equal-weighted basket of 10 space sector stocks has COLLAPSED -50% since its peak, the largest drawdown since April 2025 and the 2nd-largest since the 2022 bear market. SpaceX, $SPCX, alone is down -32% since its mid-June peak. This comes after retail investors purchased $405 million of SpaceX shares during its first 5 trading days after its June 12 IPO, the largest first-week retail purchases of any IPO ever. Mom-and-pop investors also piled into leveraged ETFs linked to SpaceX, purchasing $65.8 million of the 2x Leveraged Long SpaceX ETF, $SPCH, over its first few trading sessions. The fund is down -56% since the June 16 peak, posted on the 2nd trading day after its launch. Source: Thomas Callum, Topdown charts
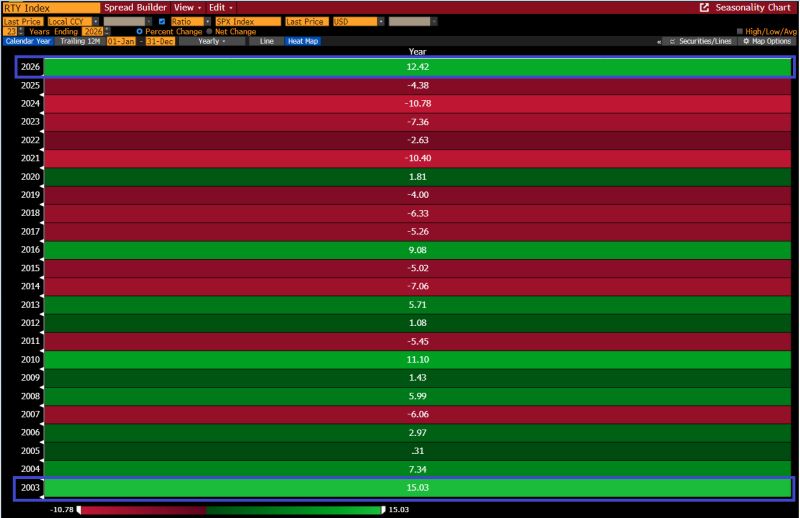
"The Russell 2000 small-caps index is outperforming the S&P500 by ~1,240 bps thus far in 2026: if this holds it would mark the largest year of Small Cap outperformance since 2003" - GS
Source: zerohedge
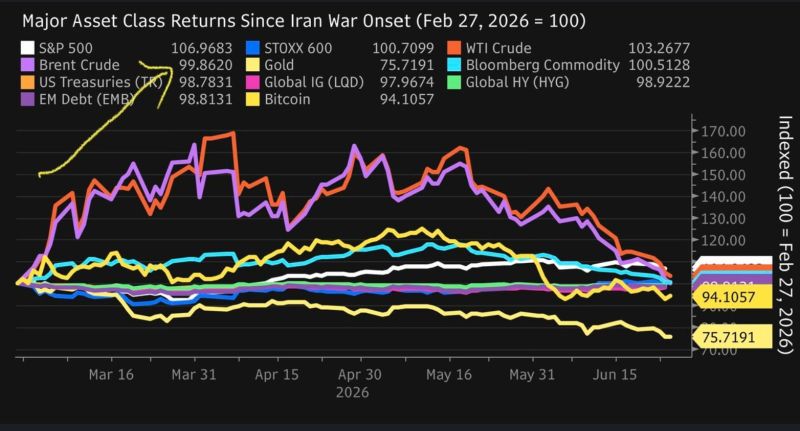
Brent crude is now trading below where it was before the Iran conflict began.
Think about that. The market has effectively priced in a clean resolution to one of the largest geopolitical energy shocks in recent history. That's a powerful reminder that markets don't wait for certainty. They price the most likely outcome. But while the geopolitical risk premium may have disappeared from prices, that doesn't necessarily mean the underlying risk has... Stay tuned Source: Blackrock, UBS
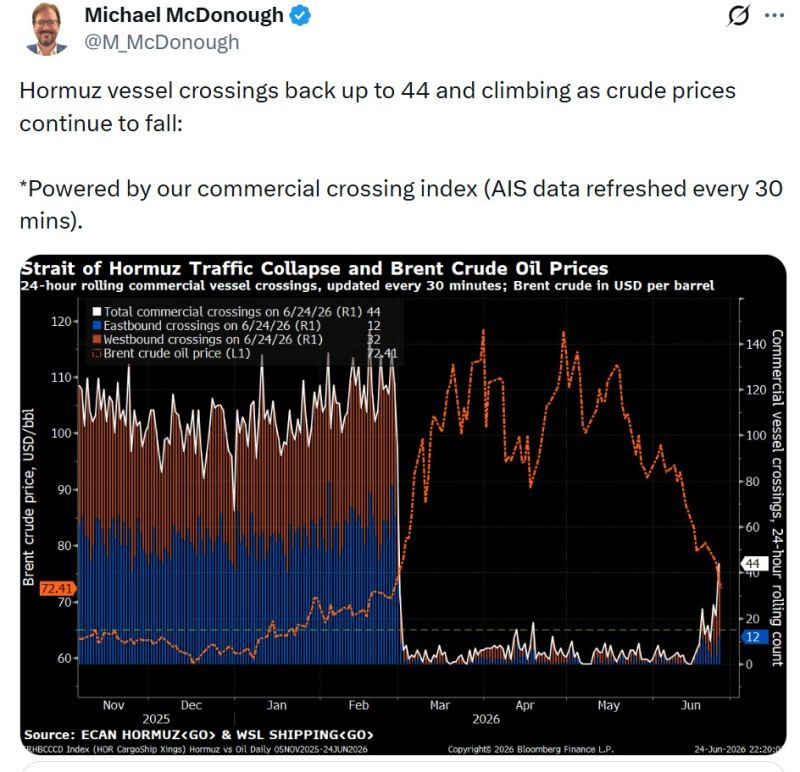
Hormuz vessel crossings back up to 44
and climbing as crude prices continue to fall:
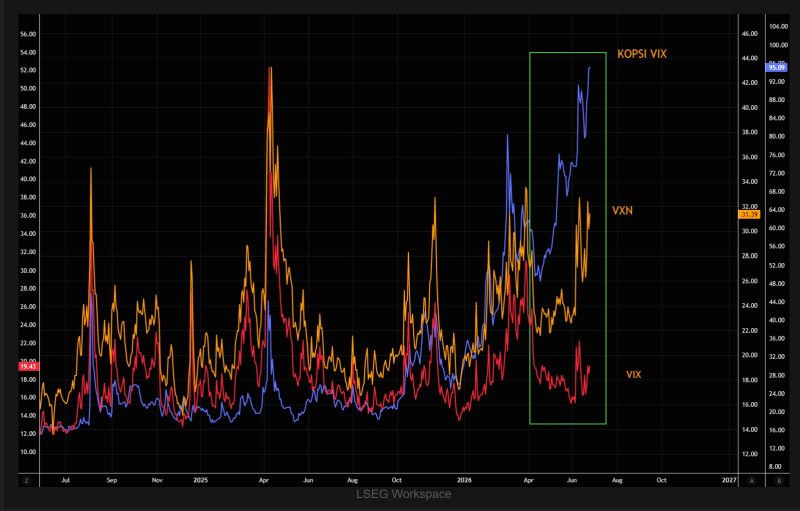
Today's vol regime explained in one chart
This chart explains today's volatility regime remarkably well. Massive leverage and extreme AI speculation continue to drive global tech volatility, with Korea's KOSPI remaining the epicenter of the mania. First KOSPI VIX Then Nasdaq volatility And finally the "boring" VIX... Source: TME
Nancy Pelosi disclosed 2 new stock trades:
- Intel $INTC Calls: Bought 200 calls on May 29th at a $50 strike price expiring 3/19/27 spending between $1,000,001 - $5,000,000 on the calls - Uber $UBER Calls: Bought 200 calls on May 29th at a $50 strike price expiring 3/19/27 spending between $500,001 - $1,000,000 on the calls Source: Evan

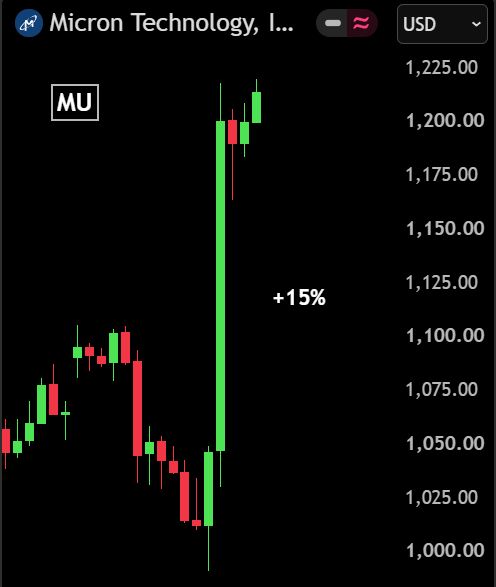
Micron just delivered one of the biggest earnings beats in semiconductor history.
The numbers are staggering: • Revenue: $41.46B vs $36.3B expected (+14%) • Adjusted EPS: $25.11 vs $21.05 expected (+19%) • Gross Margin: 84.6%, up from 37.7% a year ago 📈 Shares jumped +15% in after-hours trading. But the real story isn't this quarter. It's what's coming next. Micron's guidance absolutely crushed Wall Street: ➡️ Q4 Revenue: $50B vs $43B expected ➡️ Q4 EPS: $31 vs $25.07 expected ➡️ Gross Margin: 85% vs 84% expected The AI memory boom is accelerating faster than almost anyone expected. Micron also announced $22 BILLION in multi-year customer supply agreements, including: • Take-or-pay contracts • Customer cash deposits • Pricing floors Even more remarkable: 🔥 HBM3E and HBM4 production is already fully booked through 2027. 🔥 Demand is now extending into 2028. That's an extraordinary level of visibility for the AI infrastructure cycle. Here's the perspective that really stands out: Micron generated more profit this quarter than Nvidia made almost exactly one year ago. Yet Micron still trades at roughly a $1.1 trillion market cap. The AI infrastructure buildout isn't slowing down. If anything... It's accelerating. The AI race is no longer just about GPUs. Memory has become one of the biggest bottlenecks—and one of the biggest winners. The semiconductor cycle has entered a completely different phase. Source: Bull Theory