Straight from the Desk
Syz the moment
Live feeds, charts, breaking stories, all day long.
- All
- equities
- United States
- Macroeconomics
- Food for Thoughts
- markets
- Central banks
- Fixed Income
- bitcoin
- Asia
- europe
- investing
- geopolitics
- gold
- technical analysis
- Commodities
- Crypto
- AI
- Technology
- nvidia
- ETF
- earnings
- Forex
- china
- Real Estate
- oil
- banking
- Volatility
- energy
- magnificent-7
- apple
- Alternatives
- emerging-markets
- switzerland
- tesla
- United Kingdom
- Middle East
- assetmanagement
- amazon
- microsoft
- russia
- ethereum
- ESG
- meta
- Industrial-production
- bankruptcy
- Healthcare
- Turkey
- Global Markets Outlook
- africa
- Market Outlook
- brics
- performance
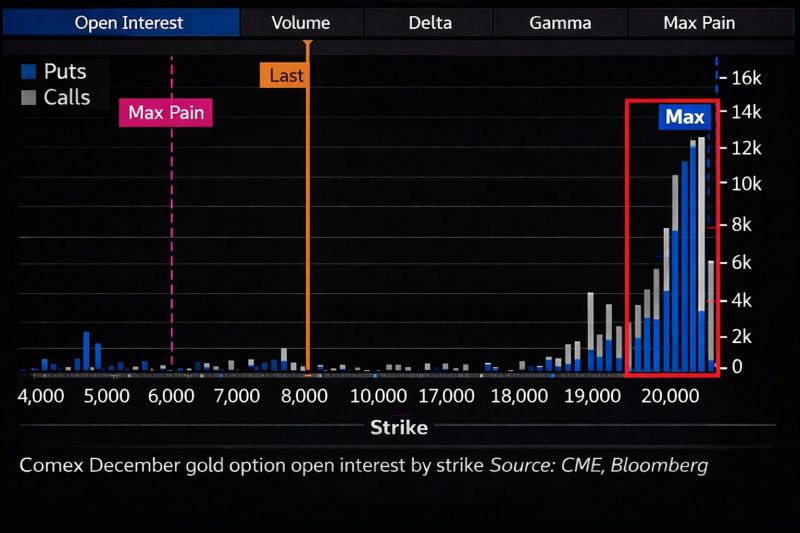
THE BIG MONEY IS QUIETLY POSITIONING FOR A GOLD EXPLOSION.
While retail investors are panic-selling the dip, the "smart money" is doing something absolutely radical. I’m looking at the COMEX data, and the numbers are staggering. The Strategy: Insiders are loading up on gold options with strike prices between $15,000 and $20,000 for December 2026. The Context: Current Gold Price: ~$4,961 The Target: A 3x to 4x increase in value. Here is the part most people missed: This buying spree didn't happen during the hype. It started right after gold hit $5,600 and "dumped" hard. When the price dipped below $5,000, retail investors ran for the exits. They saw a correction; the insiders saw a generational entry point. Right now, they are sitting on over 11,000 contracts. Why does this matter? Because you don’t place a bet that gold will triple out of "optimism." You do it because you see a fundamental shift in the global financial system that others are ignoring. Source: Alex Mason @AlexMasonCrypto
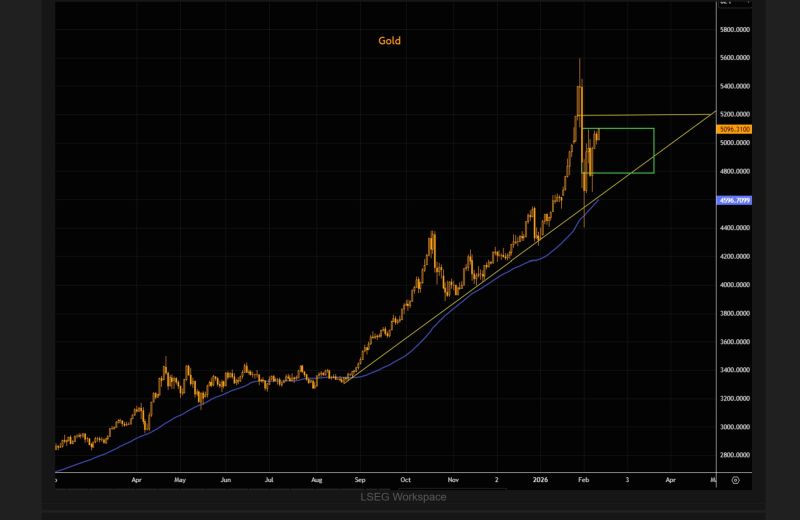
TME: "Gold bounced cleanly off the 50-day and the longer-term trend line.
We’re now trading at the highest levels since that bounce, hovering around the 50% retracement of the large down candle. So far, this has been a textbook rebound as positioning resets. gold likely needs more time to consolidate. $5,200 stands out as major resistance, while $4,800 marks key support". Source: TME
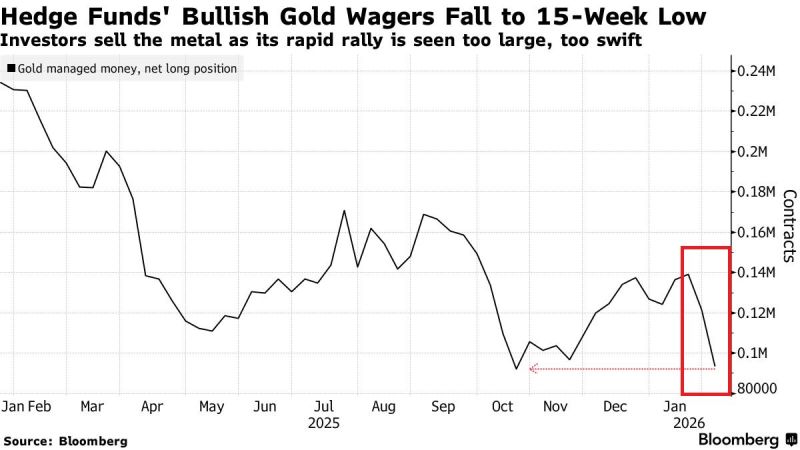
🔴Hedge funds are pulling back from gold at the fastest pace in months:
Net long positions in gold dropped -23% last week, to 93,438 contracts, the lowest in 15 weeks and near the lowest in at least 12 months. This comes after gold suffered its biggest single-day plunge since 2013 on January 30. Net long positioning has now fallen -60% from the February 2025 peak of ~240,000 contracts. Hedge fund sentiment on precious metals is shifting rapidly. Source: Global Markets Investor, Bloomberg
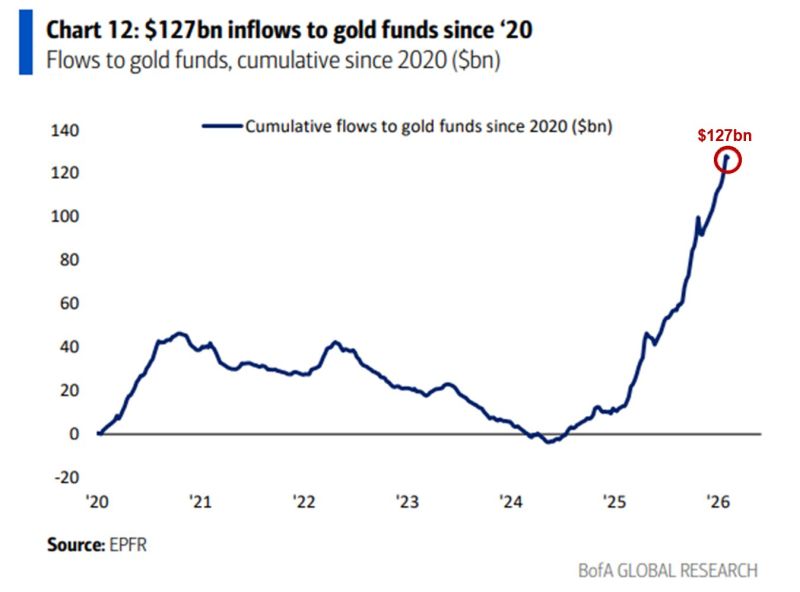
🔥Gold fund inflows are going parabolic:
Cumulative inflows to gold funds have surged to +$127 billion since 2020, according to BofA. Nearly +$120 BILLION has come since the start of 2025. Meanwhile, gold and gold mining ETFs received a record $91.86 billion worth of inflows in 2025, more than 8 TIMES the total in 2024. This all comes as gold hit multiple record highs over the last 2 years, and central bank buying remains historically elevated. Source: Global Markets Investor, BofA
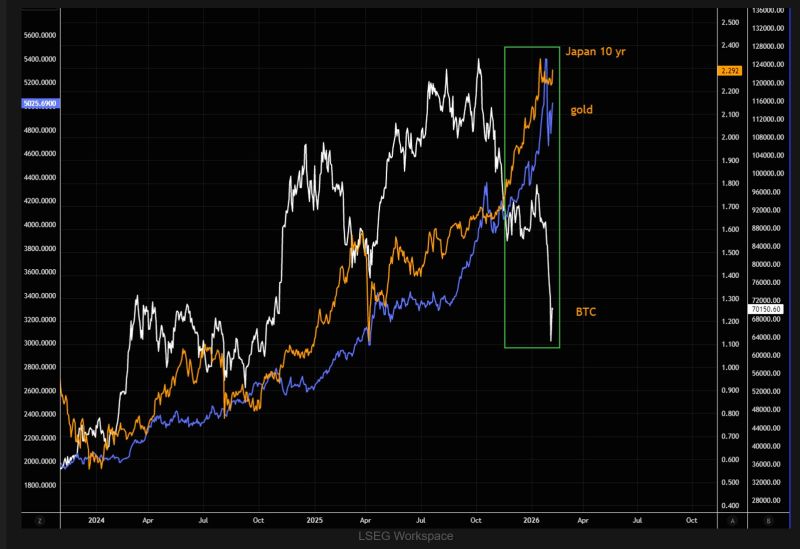
J.P. Morgan in 1912: "Gold is money. Everything else is credit."
Source: Barchart
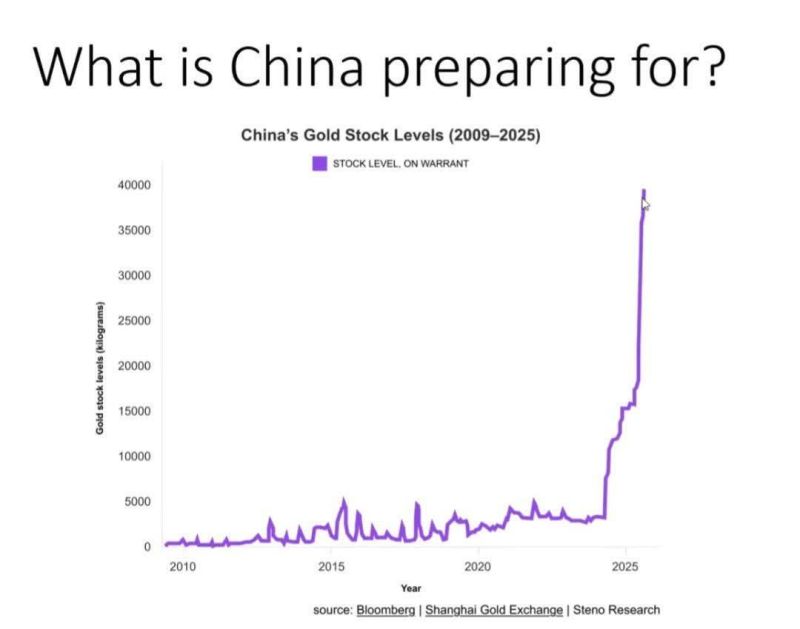
The Chinese leader told his people to hold gold. The people responded. Demand skyrocketed.
Now, the directive has shifted: Get USD off the books. The banks will respond. We aren't just talking about a policy change. We are talking about a fundamental shift in the global monetary order. Why does this matter? Liquidity is shifting: When the world's second-largest economy pivots away from the Dollar, the ripples hit every portfolio. Gold is the anchor: Central banks are returning to "real" assets as a hedge against geopolitical volatility. The Signal: When a superpower tells its financial institutions to de-risk from a specific currency, the "quiet part" is being said out loud. The world is de-dollarizing faster than most people realize. Source: Blomberg, Steno Research
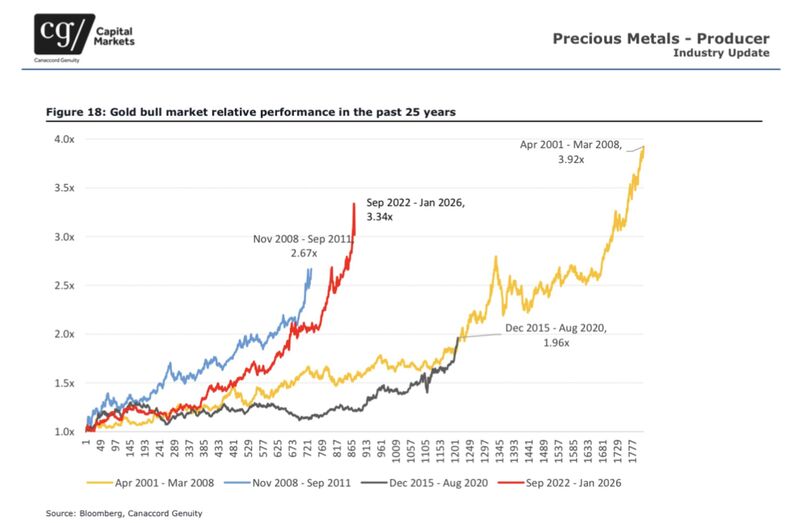
Current gold bull market in historical perspective
Source: Willem Middelkoop @wmiddelkoop Canaccord Genuity Bloomberg
Investing with intelligence
Our latest research, commentary and market outlooks


