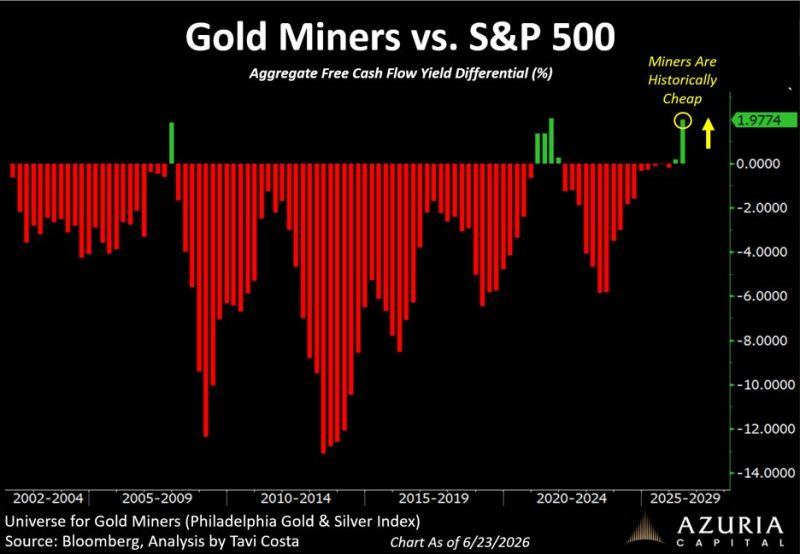
Gold miners are trading at one of the deepest discounts to the S&P 500 on record.
Fundamentals remain strong. Prices keep falling. Source: Otavio (Tavi) Costa
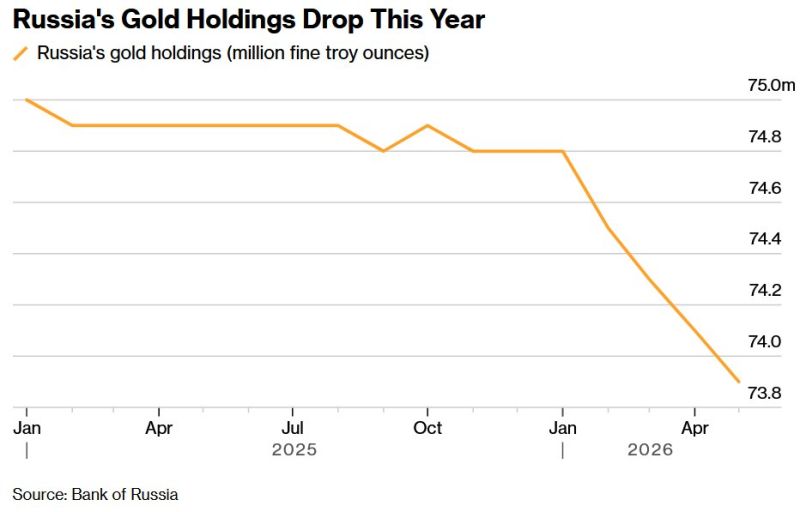
Russia is dumping its gold!
The country that was once the world's largest sovereign buyer has now sold over $4bn worth of its reserves this year. Its holdings are now at the lowest level since the day it invaded Ukraine. The reason: energy revenues are not covering the war's costs, and Russia is looking to plug the budget gap. The irony is that it's doing this at record gold prices. The only silver lining for Moscow is that it picked a good time to sell. Source: Bank of Russia, Bloomberg
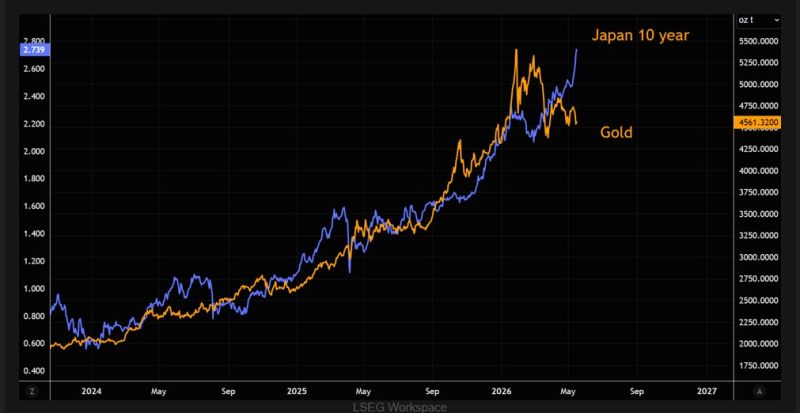
The "ultimate" hedge?
Gold followed the surge in Japanese rates throughout 2025. Gold started the year by materially overshooting the Japan 10-year, but we have since seen the Japanese long end explode higher and overshoot gold instead. Could this divergence finally trigger another squeeze higher in gold? Source: TME, LSEG
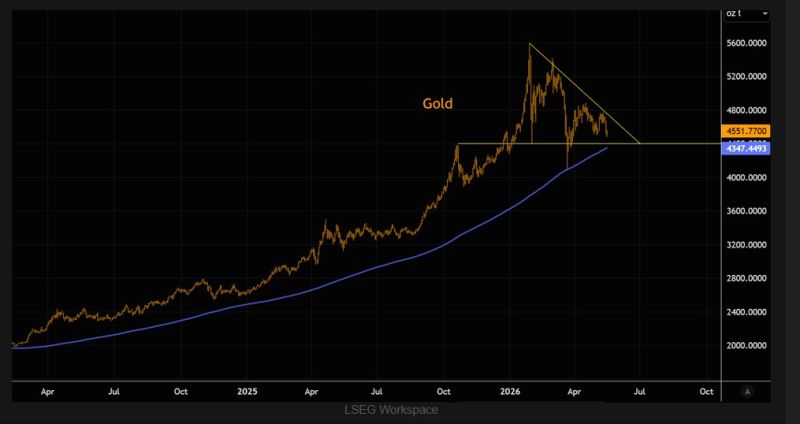
$4400 on gold: this support MUST hold
Gold has continued its huge consolidation phase following the violent pukes we saw earlier this year. The shorter-term trend line has survived several tests, but we are now approaching the major $4400 level, with the 200 day moving average coming in just below. That is the must hold area. Source: TME, LSEG Workspace
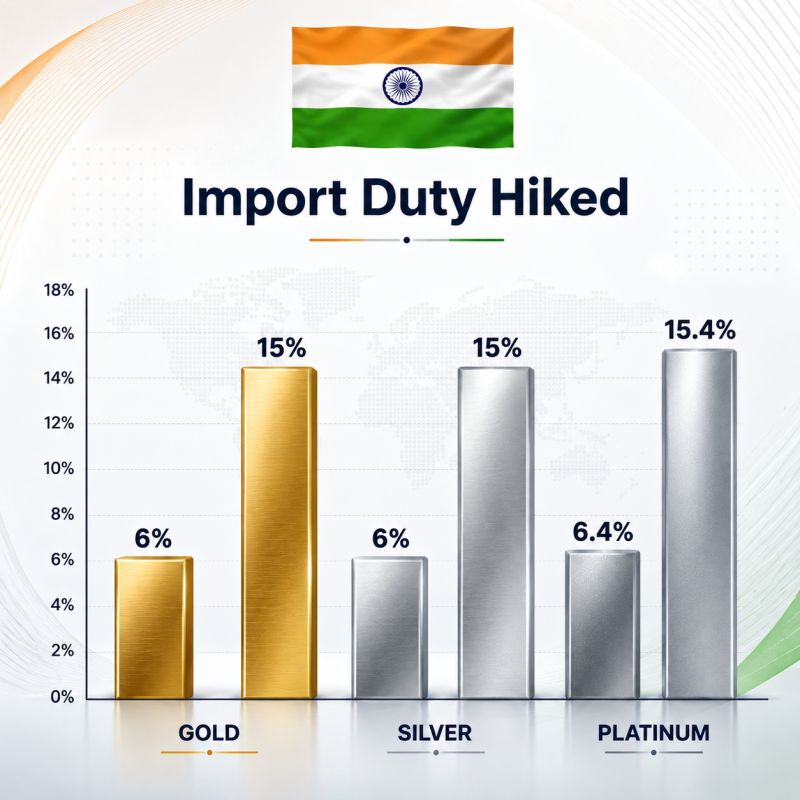
India hikes bullion import duties as the world’s second-largest gold market faces a declining rupee.
India has increased import duties on gold and silver from 6% to 15% (including basic customs duty and a 5% Agriculture Infrastructure Cess), significantly raising domestic prices by roughly ₹12–13 lakh per kg for gold and ₹24,000–25,000 per kg for silver. The move is aimed at curbing a sharply rising import bill, with gold imports reaching a record $71.98 billion in FY26 and silver imports surging 162%, amid broader macro pressures such as higher crude prices, a weaker rupee, and geopolitical uncertainty. Authorities expect a potential 15–20% reduction in imports, saving $10–15 billion in foreign exchange outflows, though past patterns suggest possible offsets through smuggling, unofficial premiums, and higher recycling. The policy may also be part of a broader effort to shift household wealth away from physical gold holdings toward financial assets, but it remains unclear whether this is a temporary measure or a structural shift. Source: CR
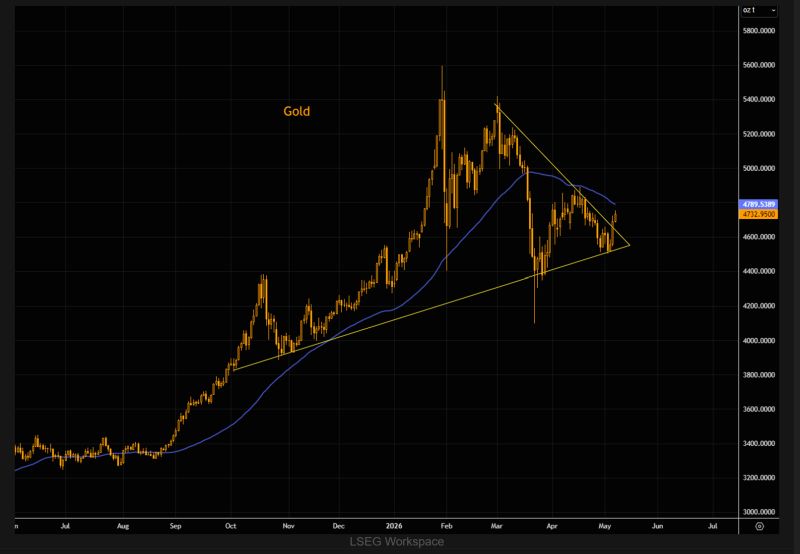
Yesterday, Gold put in its biggest up day in quite some time during yesterday’s session.
The shiny metal broke above the short-term downtrend line and also pushed out of a dynamic wedge-like formation. The key for a more sustained squeeze is a close above the $4800 area, right where the 50-day moving average comes in. More on gold. Source: TME
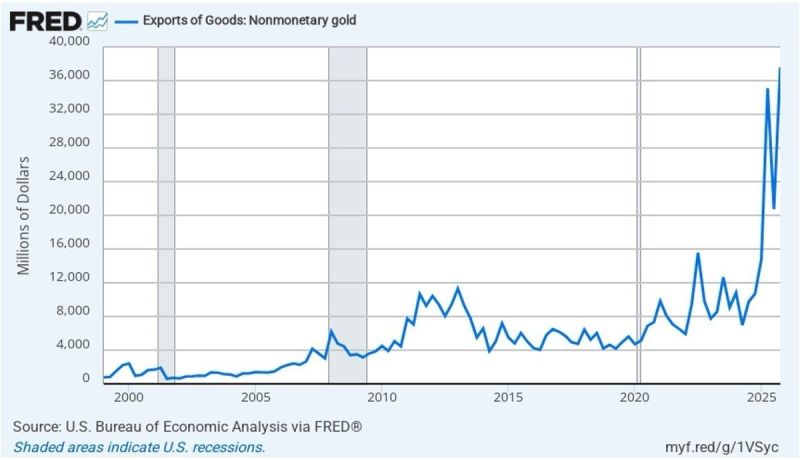
Gold is now America's biggest export, and has been for the last 5 months.
In March, U.S. gold exports were 1.7x larger than oil, 2x larger than pharma, and 2.5x larger than aircraft engines. Most of it is flowing through Switzerland and then straight into China. This is historically abnormal. The U.S. doesn't export gold at this scale under normal conditions. What's driving it: geopolitical tension, inflation hedging, and growing signals that gold is quietly becoming a settlement mechanism in U.S.-China trade flows. The world's reserve currency country is shipping its oldest store of value to its biggest rival at a record pace. That's worth paying attention to. Source: Bloomberg, FRED
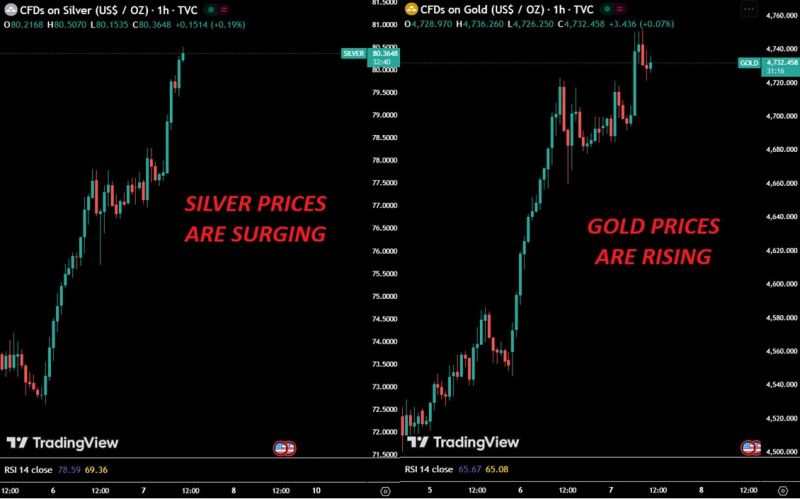
🔥Silver and gold prices are surging:
Silver and gold are up +4.5% and +1.0% on Thursday, on track for the 3rd consecutive day of gains. Silver is now up +10% and gold is up +4.0% over the last 2 trading sessions. Following the recent pullback, investors are returning to gold and silver, with many viewing this dip as a buying opportunity. Furthermore, global growth concerns, central bank demand, and a macro environment increasingly favoring hard assets continue to support prices, reinforcing the broader bullish backdrop. At the same time, decades of underinvestment and constrained supply growth have created a structurally higher price environment for precious metals. Is another leg of the precious metals bull run now unfolding? Source: Global Markets Investor