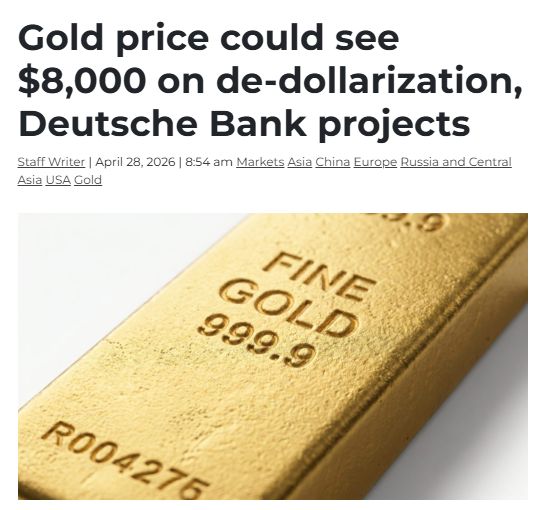
The German investment bank said it sees a scenario where central banks continue to increase their gold holdings as a financial safety net to protect themselves from Western sanctions.
These central banks have added over 225 million ounces to their reserves since the 2008 financial crisis, while their holdings of US dollars have fallen from a peak of over 60% in the early 2000s to about 40% today. Gold’s share of global central bank reserves could reach 40%, up from 30% currently, the bank predicts. At that allocation, Deutsche Bank ran a simulation that projects gold prices to hit $8,000 an ounce within five years, a near 80% rise on current levels. Source: Wall Street Mav
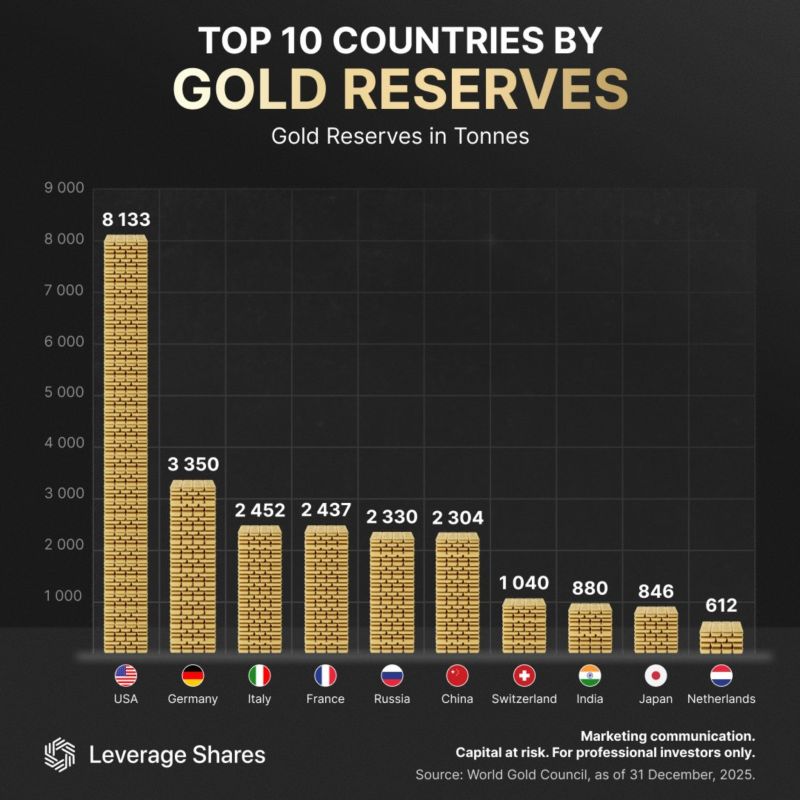
Top 10 countries by gold reserves:
Source: Wall St Engine
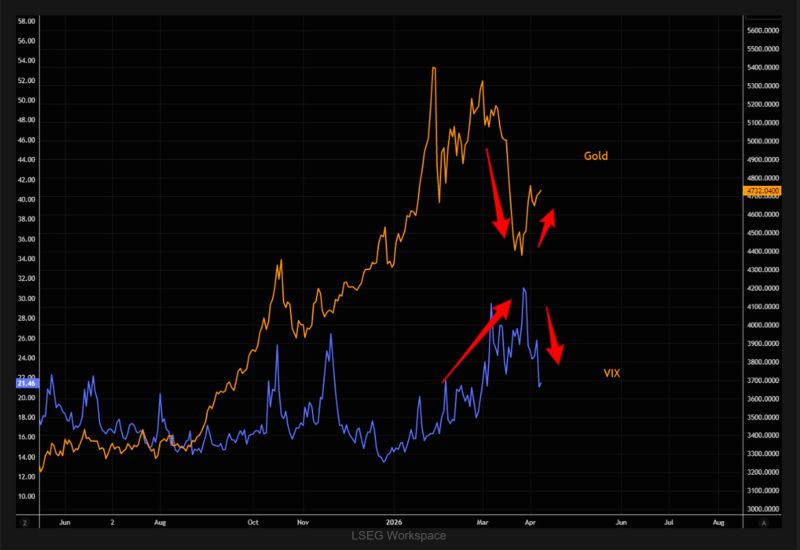
The idea of gold as a global “VIX hedge” doesn’t hold up. During the latest volatility spike, it moved in the opposite direction.
Source: The Market Ear
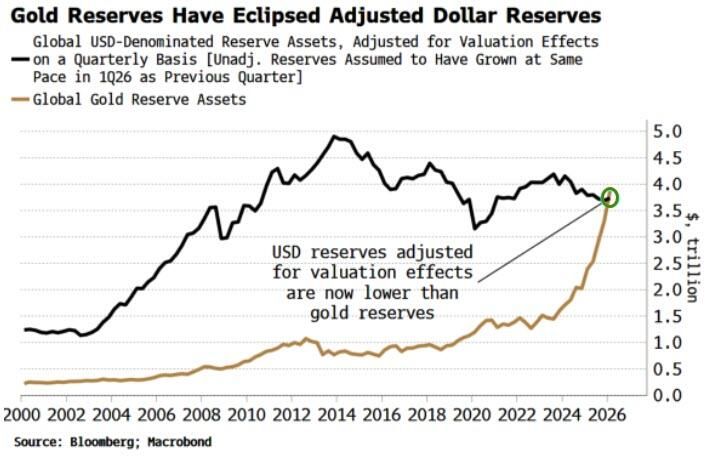
The war with Iran has done further damage to the global dollar system.
The demise of the dollar’s dominance won’t be an overnight phenomenon, but the conflict in the Middle East is one more milestone along the way. That can be seen in central bank holdings of gold exceeding valuation-adjusted dollar reserves for the first time in the Bretton Woods II era. Source: Bloomberg, Macrobond
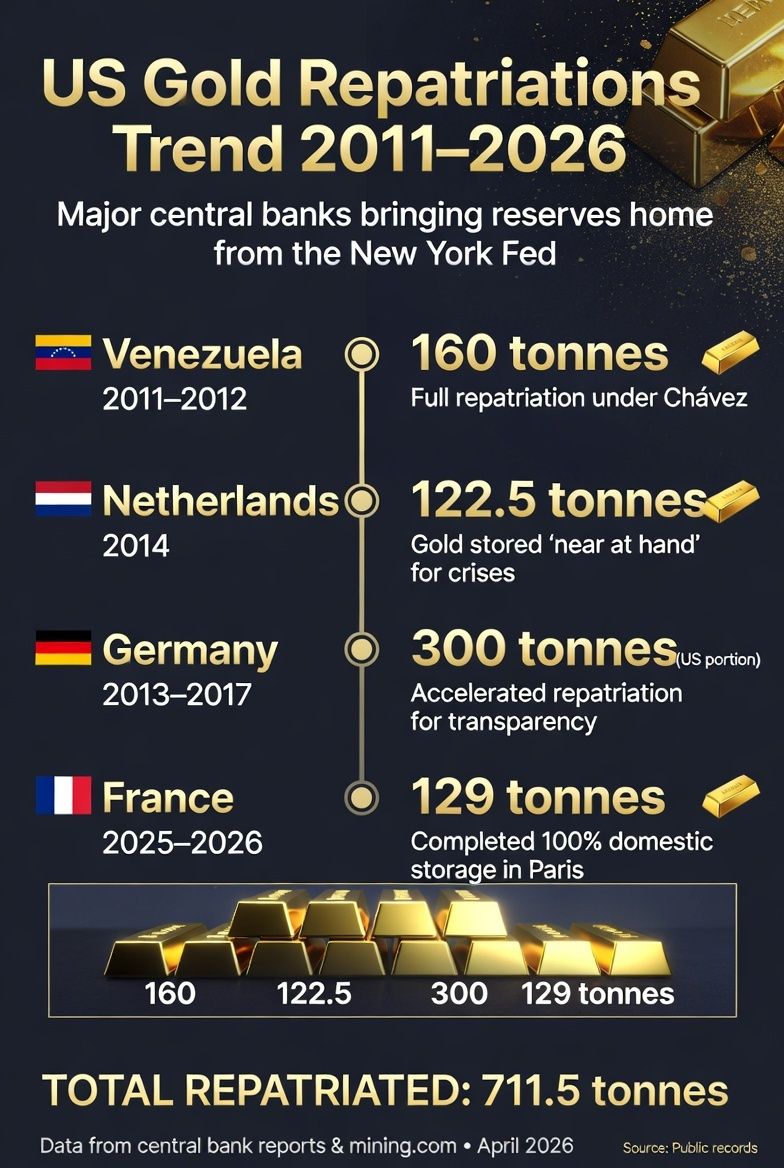
Major central banks have withdrawn a combined 711.5 tonnes of gold reserves from the New York Fed over the past 15 years.
This total is based on publicly reported repatriation by Venezuela (160t), the Netherlands (122.5t), Germany (~300t from the US portion), and France (129t). The Bank of France recently completed its move, replacing its final 129 tonnes of US-held gold to achieve 100% domestic storage in Paris. Rather than physically shipping the bullion, BdF sold its older US bars and purchased modern standard gold in Europe between July 2025 and January 2026, generating a ~€13B ($15B) capital gain. Source: MINING.COM
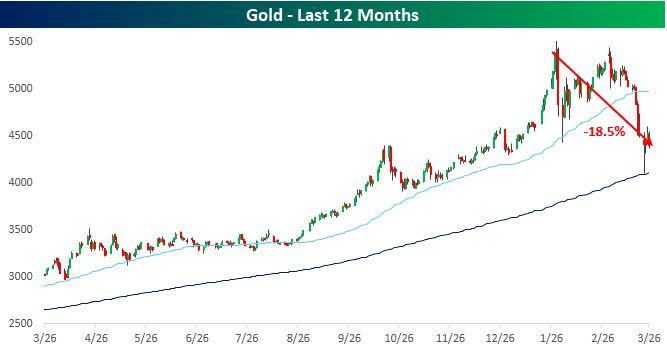
After the second-strongest bull market since at least 1974, gold is coming extremely close to bear market territory.
Source: Bespoke
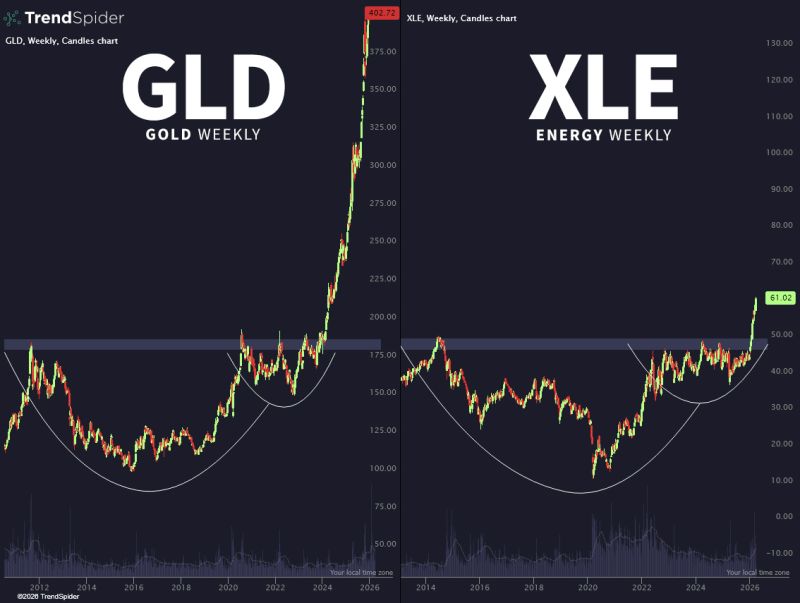
Same setup, different story. $GLD $XLE
Source: Trend Spider
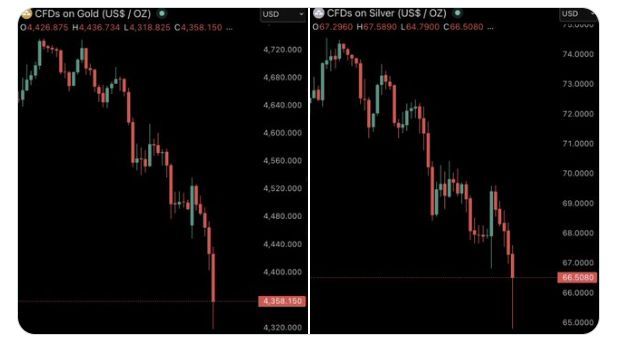
Gold drops signal rising market stress
In just three hours, gold fell ~$400, silver ~14%, erasing ~$2 trillion, defying its usual “safe haven” role amid geopolitical tension. This unusual behavior suggests large institutions may be raising cash quickly, liquidity is valued over safety, and hidden market stress could be building. Concurrently, oil retraced gains, futures remain stable, and insider selling has been heavy. Together, these signs indicate that markets react to pressure more than headlines, and even traditionally safe assets can be sold. Source: LimitLess